
Fig. 5.
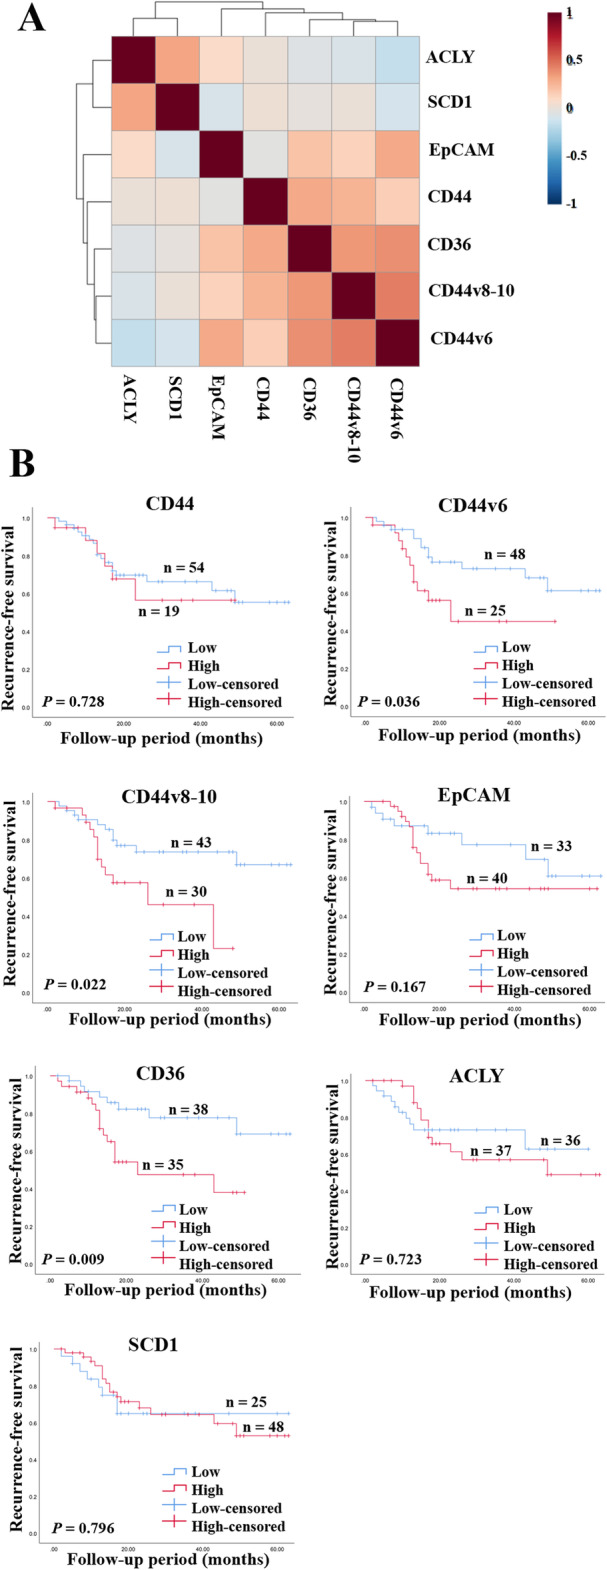
The correlation between CSC markers and proteins involved in lipid metabolism and their importance in the patient’s outcome. A The correlation heatmap with a hierarchical clustering of the levels of CSC markers and proteins involved in lipid metabolism. The magnitude of the correlation is shown by the colors with red representing a positive correlation and blue a negative correlation. B Kaplan-Meier curves representing the correlation between protein expression and recurrence. Low represents a low protein expression, high represents a high protein expression. CD cluster of differentiation, EpCAM epithelial cell adhesion molecule, ACLY ATP citrate lyase, SCD1 stearoyl-CoA desaturase-1. A p value lower than 0.05 was considered as a significant value