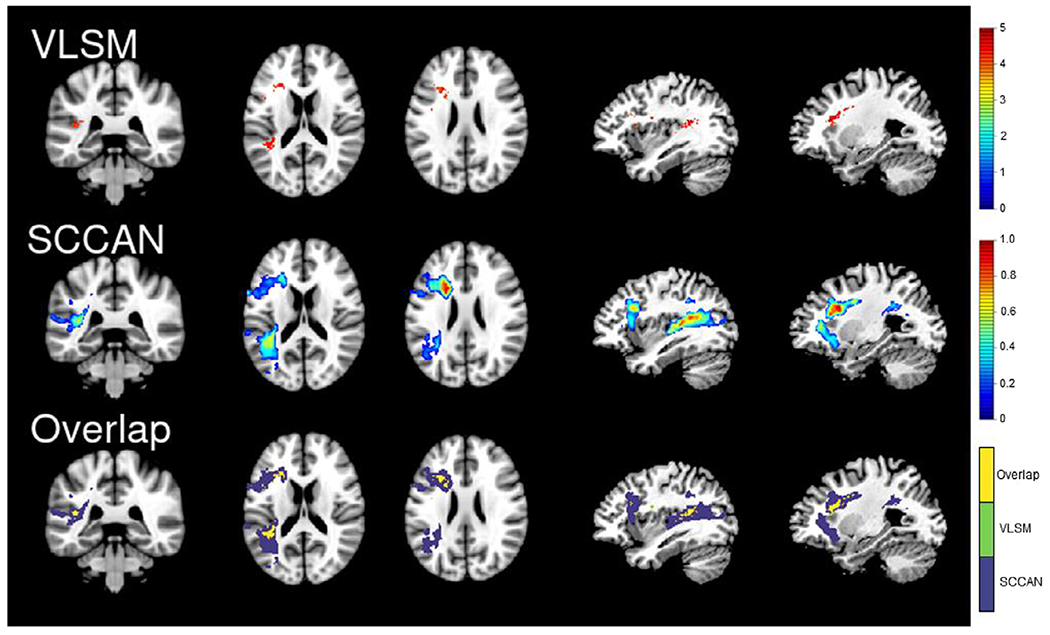
Figure 2.

Letter fluency results. The VLSM (top panel) and SCCAN (middle panel) results for semantic fluency. The bottom panel is showing the areas of overlap (yellow) between the VLSM (green) and SCCAN (purple) results. For ease of comparison, all results are shown on the same slices of an MNI template (from left to right: 90, 91, 98, 54 and 64). [Colour figure can be viewed at wileyonlinelibrary.com]
