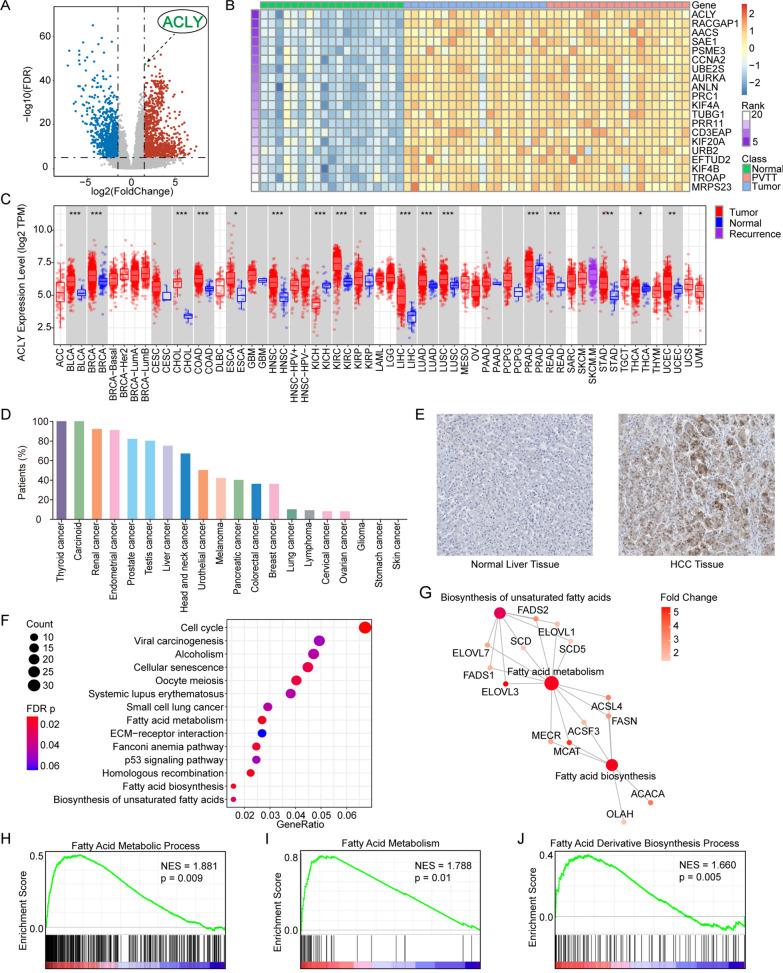
Fig. 3.
ACLY was a top differently expressed gene in HCC and other solid tumors. A Volcano plots showing DEGs in GSE77509 cohort. ACLY was an upregulated signature. B Top 20 markers identified by GSEA enrichment analysis: ACLY was at the top of the list. C An overview of ACLY expression of 40 solid tumors in TCGA dataset. D Proteomic ACLY expression rate of 20 solid tumors in HPA database. E Immunohistochemistry stained the expression of ACLY in primary HCC and adjacent normal tissue in HPA database. F Function enrich analysis indicated the top enriched pathways by KEGG annotation: fatty acid metabolism, fatty acid biosynthesis and biosynthesis of unsaturated fatty acids were positively enriched. G Interaction of fatty acid metabolism associated genes. H GSEA enrichment plots revealed activation in fatty acid metabolic process and fatty acid derivative biosynthesis process by GO annotation, along with fatty acid metabolism by KEGG annotation

