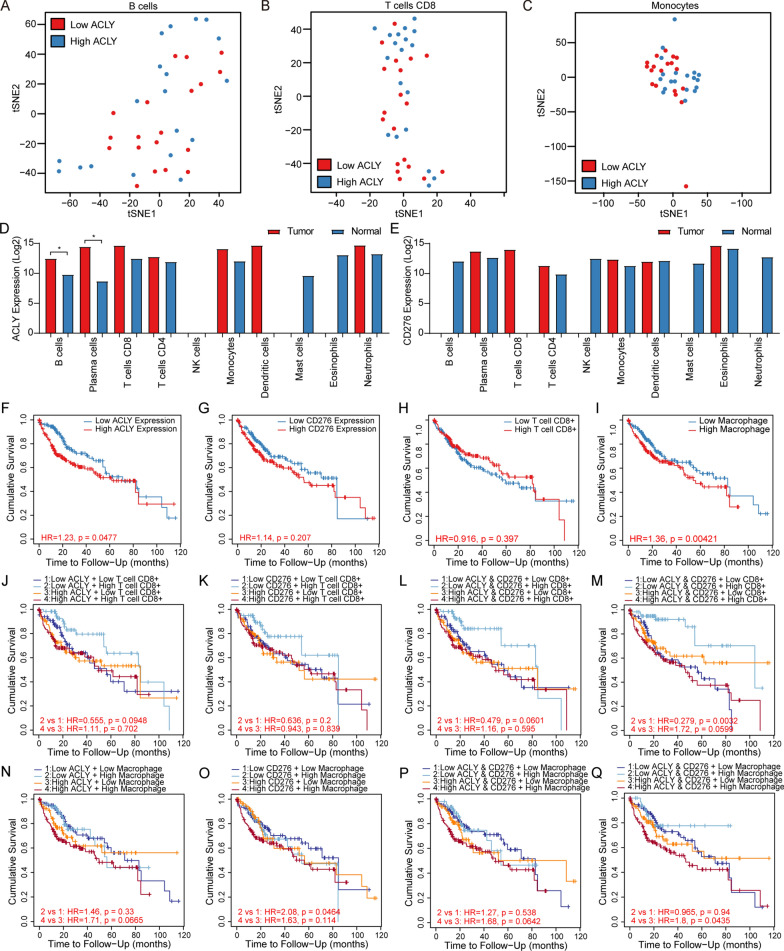
Fig. 6.
High-resolution estimation of ACLY in TIICs. ACLY combinated with immune checkpoints and TIICs elucidated strong prognostic value. A–C Distribution of samples through t-SNE analysis classified by ACLY expression. D, E Estimated transcriptomic level of ACLY and CD276 in cell-type specific view by CIBERSORTx. The NA values are genes that are either not expressed or have inadequate statistical power to be imputed. F, G Kaplan–Meier curves showing outcomes of overall survival between patients with high and low expression of ACLY and CD276. H, I Survival outcomes between patients having high and low levels of CD8+ T cells and macrophages. J–M Kaplan–Meier plot showed significant differences combining ACLY and CD276 expression with estimated infiltration levels of CD8+ T cells compared with single gene expression. N–Q No significant differences was observed combining ACLY and CD276 expression with estimated infiltration levels of macrophage

