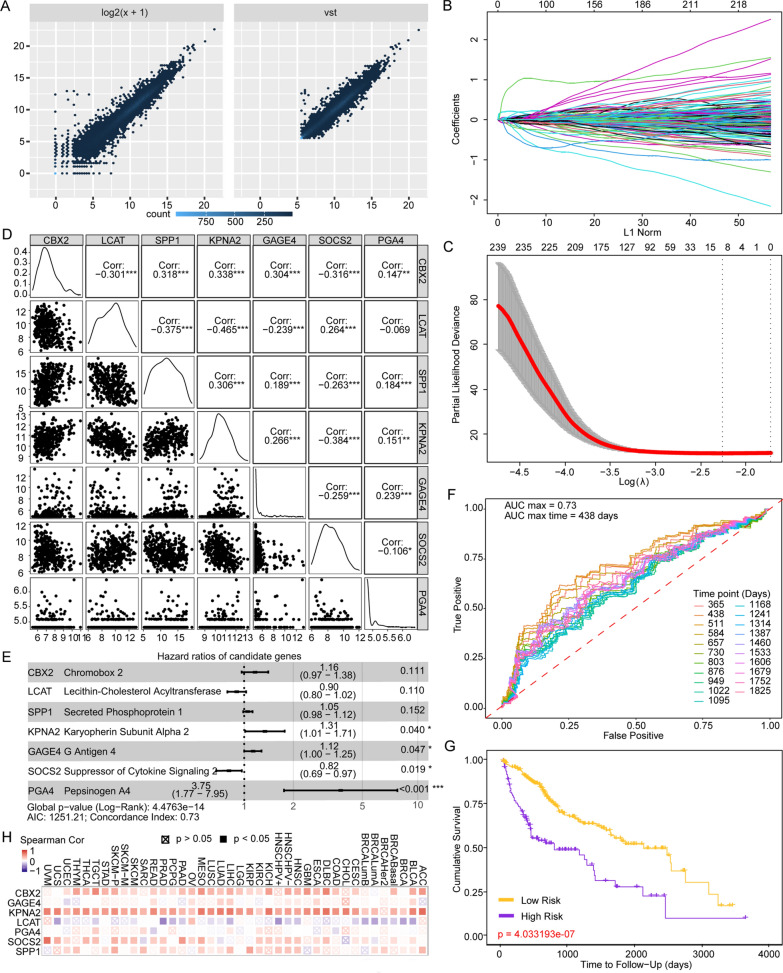
Fig. 7.
A novel gene signature in predicting survival outcomes and its relationship with ACLY. A VST transformation of DEGs for further model establishment. B LASSO coefficient of 4559 candidates. C Partial likelihood deviance was computed for LASSO regression. D Correlation matrix revealed no multicollinearity among 7 candidate genes. E Forest plot demonstrated HR and p value of multivariate Cox model enrolled genes. F Time-dependent ROC curves of different time length for optimal observation time window. G Kaplan–Meier survival analysis between patients with high-risk scores and low risk scores. H Association of ACLY with the predictive signature in 40 kinds of solid tumors

