
Figure 1.
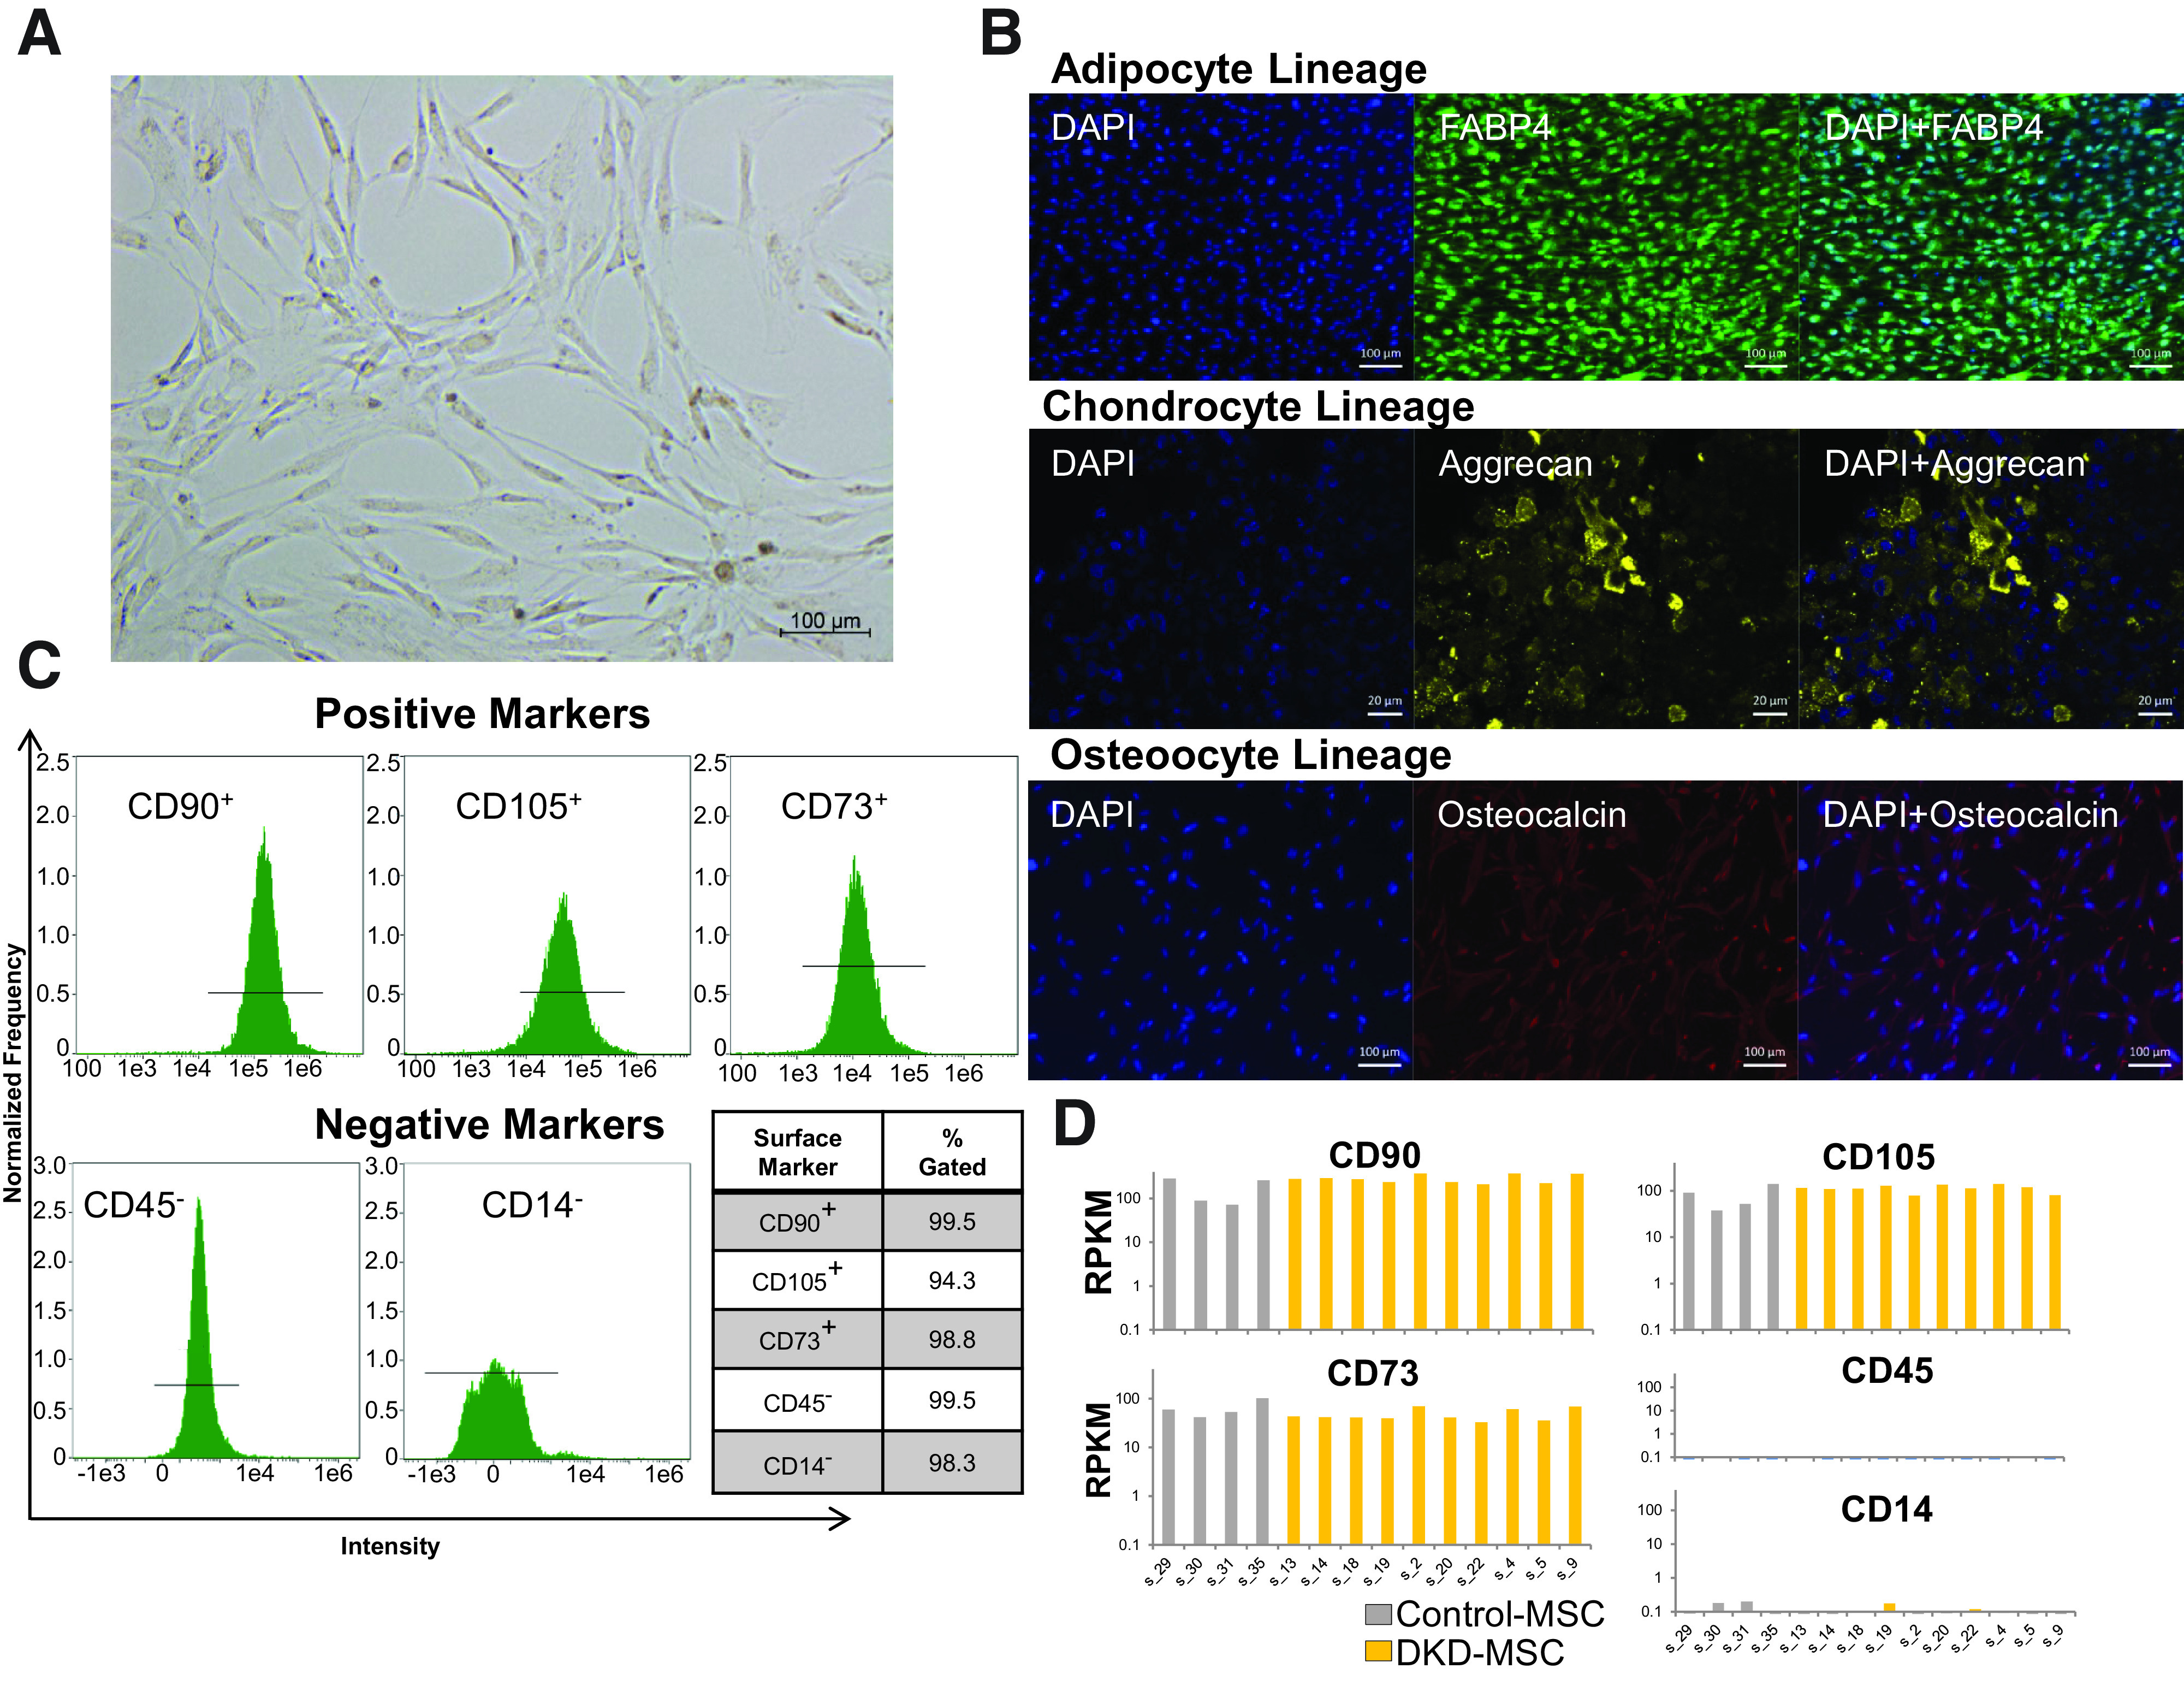
MSC phenotype and characterization. A: Adipose tissue-derived MSC harvested from participants with DKD show typical morphological appearance under the microscope as spindle-shaped, fibroblast-like cells in culture. B: Trilineage differentiation into adipocyte (FABP4, positive staining represents adipocytes), chondrocyte (aggrecan, positive staining represents chondrocytes), and osteocyte (osteocalcin, positive staining represents osteocytes) lineages is achieved in DKD-MSC. C: Cell surface markers characteristic of MSC positivity to CD90, CD105, and CD73 and negativity to CD45 and CD14 are expressed in DKD-MSC through flow cytometric analysis. D: In concordance, gene expression of MSC surface markers is similarly expressed both in Control-MSC and DKD-MSC. RPKM, reads per kilobase million reads.