
Figure 1.
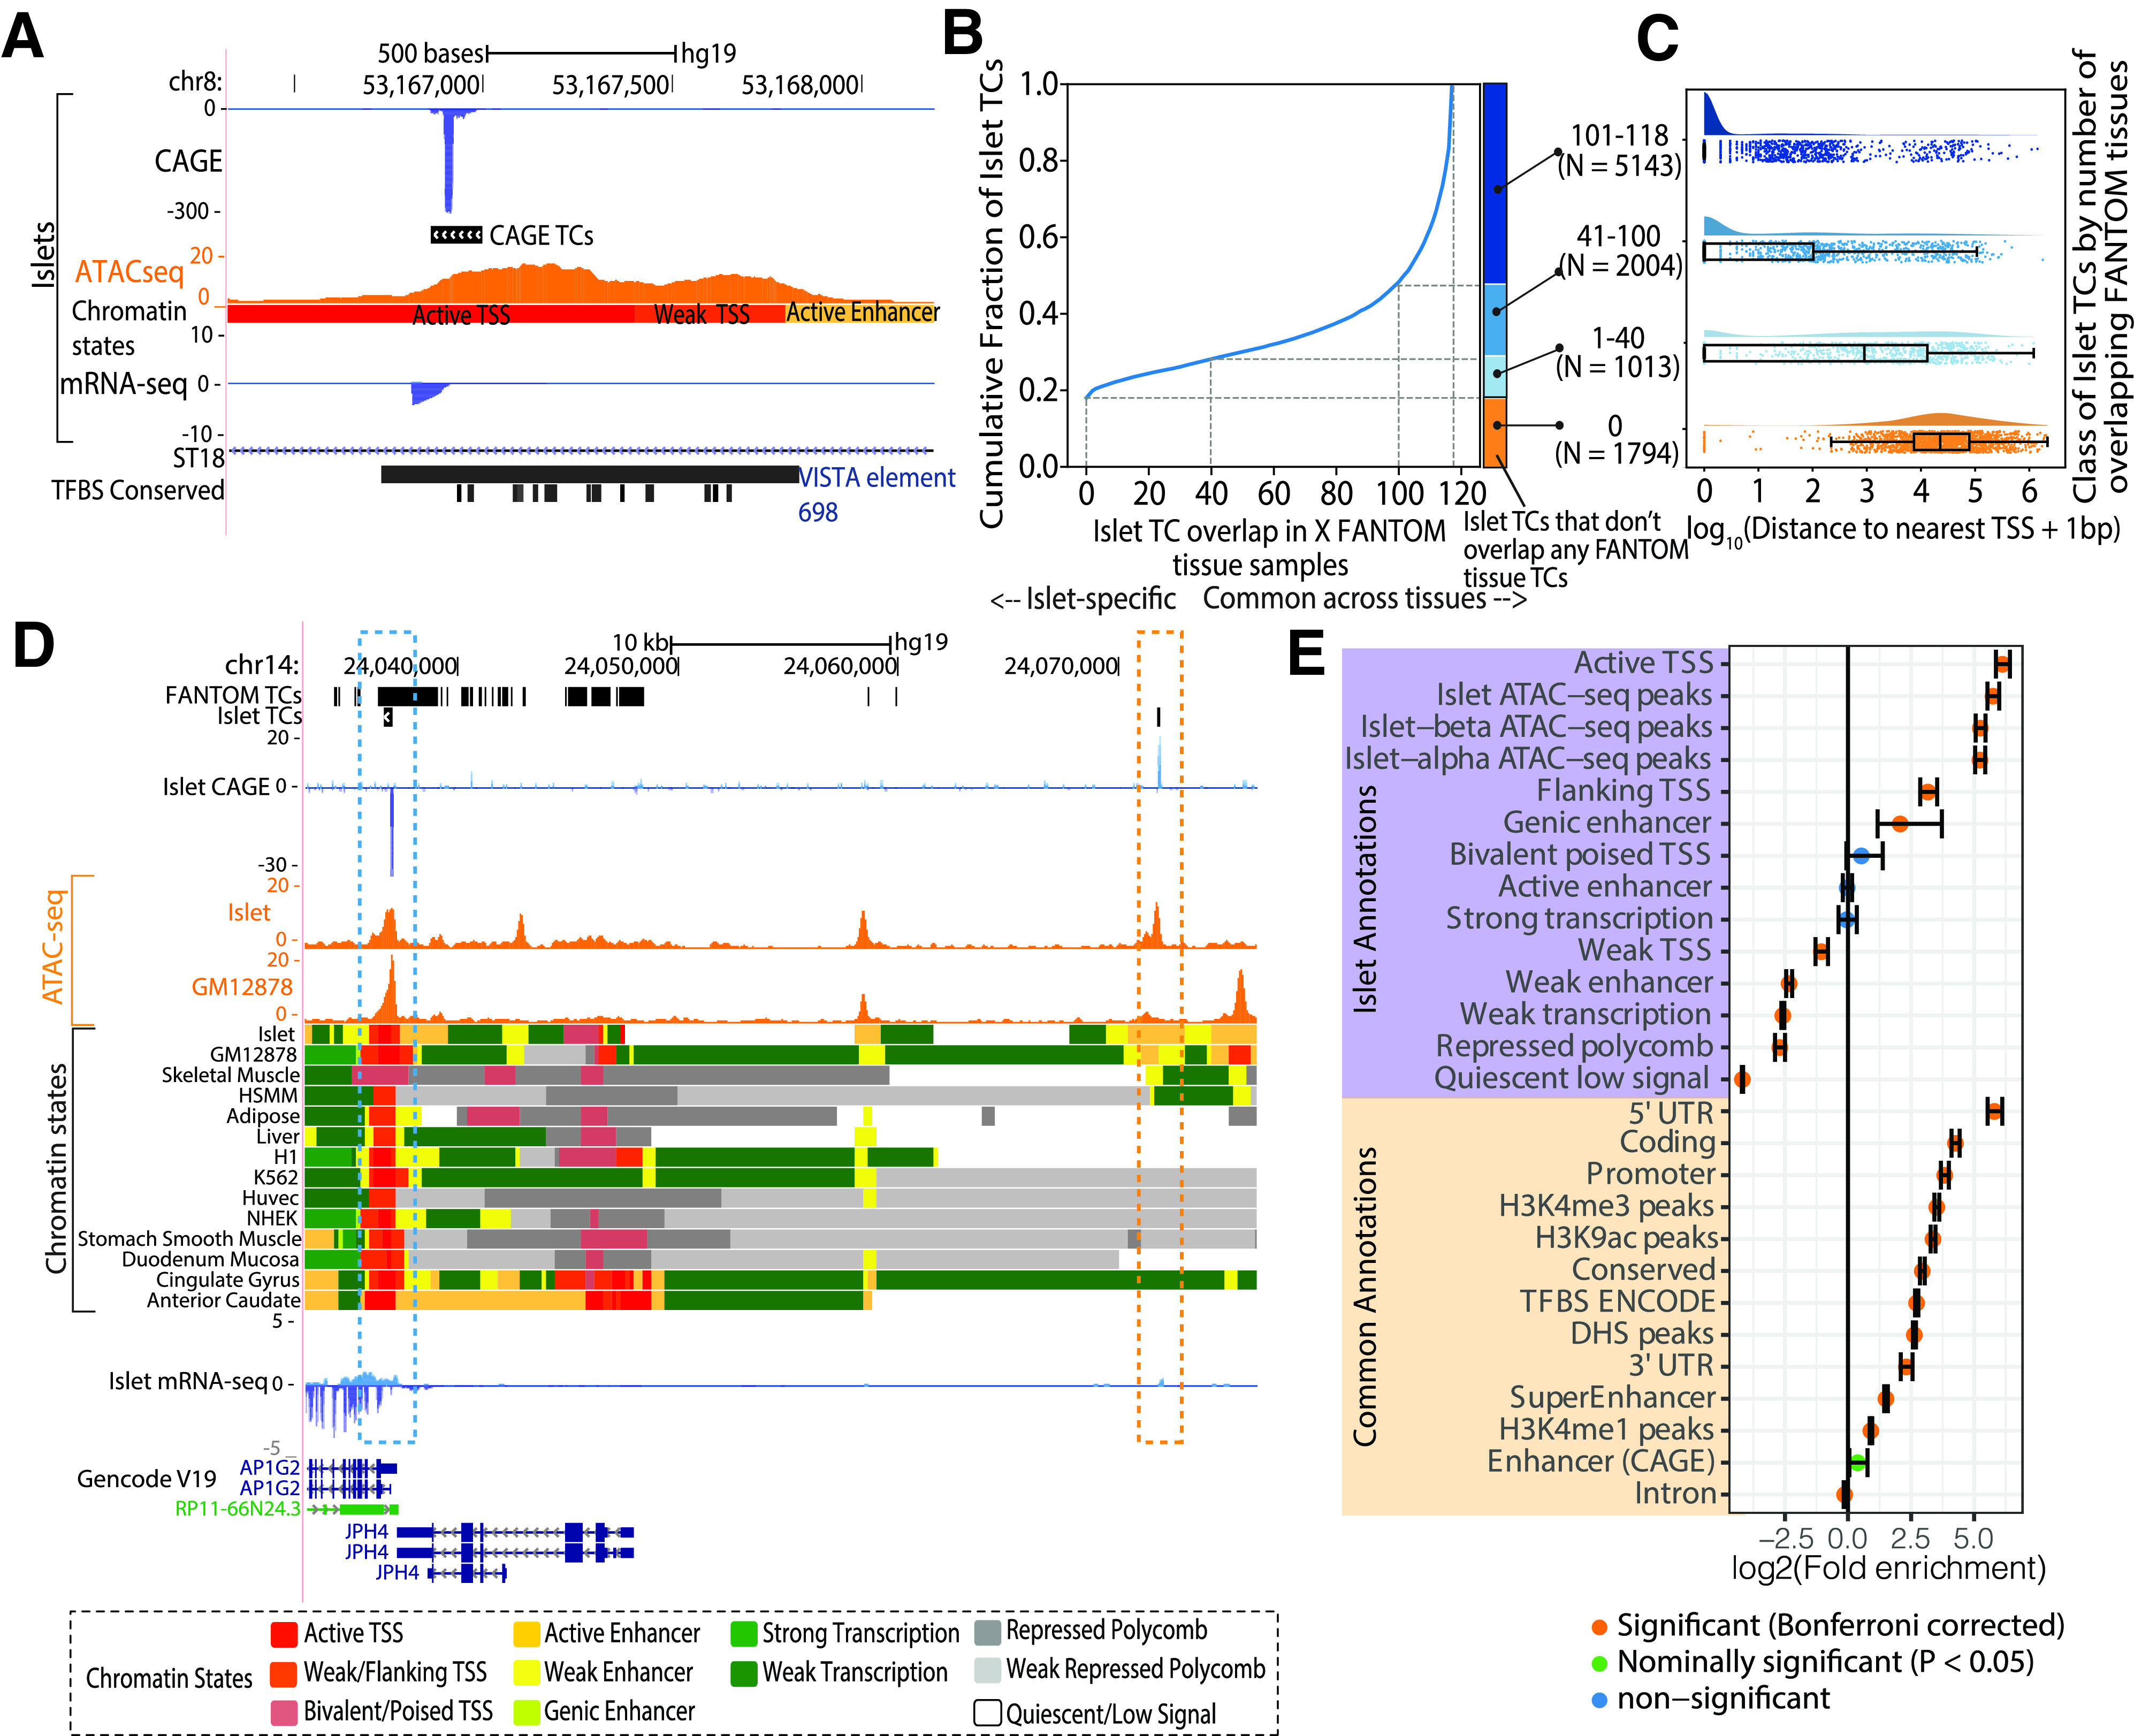
Islet CAGE TC identification. A: Genome browser view of the intronic region of the ST18 gene as an example locus where an islet TC overlaps an islet ATAC-seq peak and active TSS chromatin state. This TC also overlaps an enhancer element, which was validated by the VISTA Enhancer Browser (35). Also shown is the human-mouse-rat conserved TF binding site (TFBS) track from the TRANSFAC matrix database (51). B: Cumulative fraction of islet TC segments overlapping with TCs identified in X number of FANTOM tissues. C: Distribution of the log10(distance to the nearest known protein-coding gene TSS + 1 bp) with classification of islet TC segments by the number of FANTOM tissues where TCs overlap. Number of TC segments in each category is shown in parentheses. D: Genome browser view of an example locus near the AP1G2 gene that highlights an islet TC (blue box) that is also identified in FANTOM tissues (FANTOM TCs track is a dense depiction of TCs called across 118 human tissues), occurs in a ATAC-seq peak region in both islets and GM12878 (ATAC-seq track), and overlaps active TSS chromatin states across numerous tissues. Another islet TC (orange box) ∼34 kb distal to the AP1G2 gene is not identified as a TC in other FANTOM tissues and occurs in an islet ATAC-seq peak and a more islet-specific active enhancer chromatin state region. E: Enrichment of islet TCs to overlap islet chromatin state and other common annotations. Error bars represent the 95% CIs. Bonferroni correction accounted for 40 total annotations. HSMM, human skeletal muscle myoblasts; Huvec, Human umbilical vein endothelial cells; mRNA-seq, mRNA sequencing; NHEK, normal human epidermal keratinocytes; UTR, untranslated region.