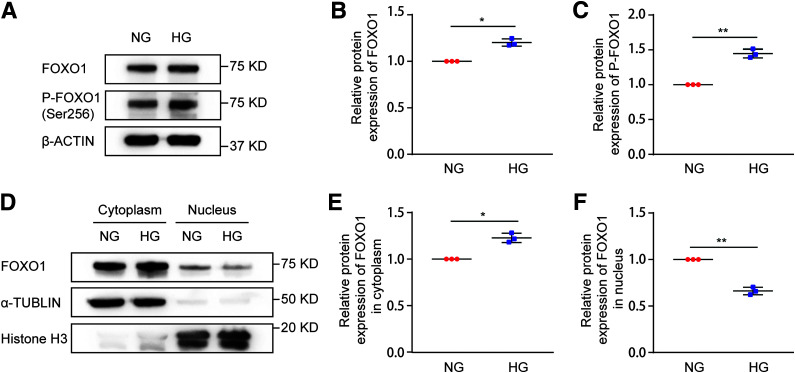
Figure 5.
HG induces FOXO1 phosphorylation and inactivation in BUMPT cells. BUMPT cells were cultured in DMEM containing 30 mmol/L glucose (HG) or 5.5 mmol/L glucose with 24.5 mmol/L d-mannitol (NG) for 8 days. Cell lysates and subcellular fractions were collected at the end of the 8th day for immunoblot analysis. A: Increased FOXO1 phosphorylation in HG-treated cells. Representative immunoblots of total FOXO1 and p-FOXO1 (Ser256) in cell lysates from the NG and HG groups. B: Densitometric analysis of total FOXO1 in NG-treated and HG-treated cells. β-Actin was used as the loading control. After normalization with β-actin, the protein level in the NG group was arbitrarily set as 1, and the protein level in the HG group was compared with that 1 to calculate the fold change. *P < 0.05 (n = 3). C: Densitometric analysis of p-FOXO1 (Ser256) in NG-treated and HG-treated cells. Total FOXO1 was used as the loading control. After normalization with total FOXO1, the protein level in the NG group was arbitrarily set as 1, and the protein level in the HG group was compared with that 1 to calculate the fold change. **P < 0.01 (n = 3). D–F: Less nuclear FOXO1 in HG-treated cells than in NG-treated cells. Histone H3 and α-tubulin were probed as respective controls for nuclear and cytoplasmic fractions. D: Representative immunoblots of total FOXO1 in cytoplasmic and nuclear fractions of NG-treated and HG-treated cells. E: Densitometric analysis of cytoplasmic FOXO1 in NG-treated and HG-treated cells. After normalization with α-tubulin, the protein level in NG-treated cells was arbitrarily set as 1, and the protein level in the HG group was compared with that 1 to calculate the fold change. *P < 0.05 (n = 3). F: Densitometric analysis of nuclear FOXO1 in NG-treated and HG-treated cells. After normalization with histone H3, the protein level in NG-treated cells was arbitrarily set as 1, and the protein level in the HG group was compared with that 1 to calculate the fold change. **P < 0.01 (n = 3).

