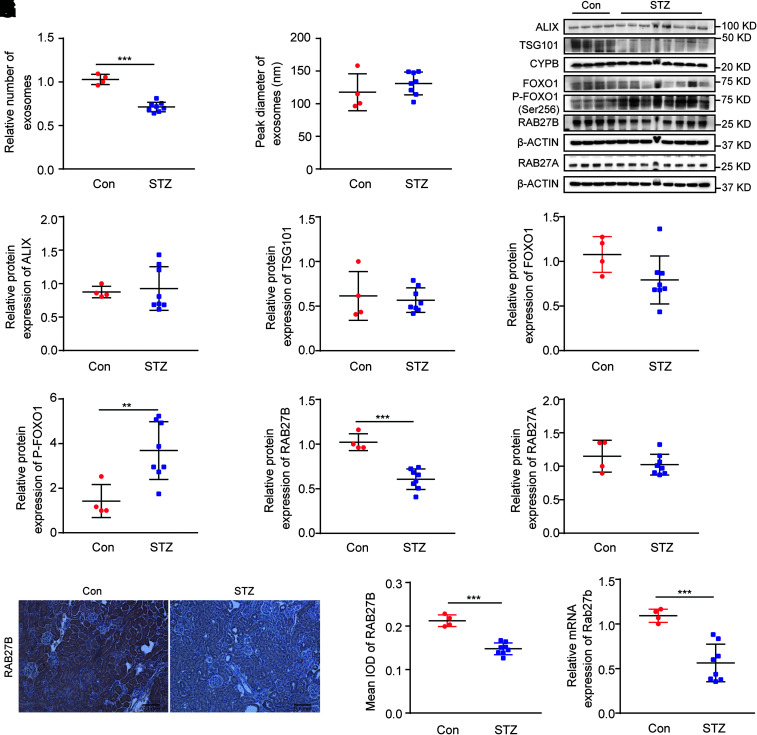
Figure 7.
FOXO1 phosphorylation, RAB27B downregulation, and decreased exosome secretion in renal cortical tissues of STZ-induced diabetic mice. C57BL/6J male mice (8 weeks) were treated with STZ to induce diabetes or with vehicle solution as the control (Con). The mice were sacrificed at 20 weeks of age to collect renal cortical tissues. A: Diabetic mice produced fewer exosomes in renal cortical tissues than nondiabetic mice. The relative number of exosomes in the control (n = 4) and STZ (n = 8) groups was based on quantification by NTA from equal weights of renal cortical tissues. ***P < 0.001. B: No significant difference in the sizes of exosomes isolated from renal cortical tissues of nondiabetic mice and diabetic mice. Peak diameter of exosomes was analyzed by NTA in control (n = 4) and STZ (n = 8) groups. C–I: Increased FOXO1 phosphorylation and decreased RAB27B expression in renal cortical tissues of diabetic mice. C: Representative immunoblots of ALIX, TSG101, FOXO1, p-FOXO1 (Ser256), RAB27B, and RAB27A. Densitometric analyses of ALIX (D) and TSG101 (E) in the control (n = 4) and STZ (n = 8) groups. Cyclophilin B was used as the loading control. After normalization with cyclophilin B, the protein level of the control group was arbitrarily set as 1, and the protein level of other mice was compared with it to calculate the fold change. F: Densitometric analysis of total FOXO1 in the control (n = 4) and STZ (n = 8) groups. β-Actin was used as the loading control. After normalization with β-actin, the protein level of the control group was arbitrarily set as 1, and the protein level of the other mice was compared with it to calculate the fold change. G: Densitometric analysis of p-FOXO1 (Ser256) in the control (n = 4) and STZ (n = 8) groups. p-FOXO1 was normalized with total FOXO1. After normalization, the protein level of the control group was arbitrarily set as 1, and the protein level of other mice was compared with it to calculate the fold change. **P < 0.01. Densitometric analyses of RAB27B (H) and RAB27A (I) in the control (n = 4) and STZ (n = 8) groups. β-Actin was used as the loading control. After normalization with β-actin, the protein level of the control group was arbitrarily set as 1, and the protein level of other mice was compared with it to calculate the fold change. ***P < 0.001. J and K: Immunohistochemistry showing decreased RAB27B expression in diabetic mouse kidneys. J: Representative immunohistochemistry images. Original magnification ×10; scale bar, 0.1 mm. K: Quantitative analysis of RAB27B staining by Image-Pro Plus in the control (n = 4) and STZ (n = 8) groups. ***P < 0.001. M: Decreased mRNA level of Rab27b in renal cortical tissues of diabetic mice. The mRNA level of Rab27b was detected by real-time PCR in the control (n = 4) and STZ (n = 8) groups. β-Actin was used as the reference gene. After normalization with β-actin, the mRNA level of the control group was arbitrarily set as 1, and the mRNA levels of the other mice were compared with it to calculate the fold change. ***P < 0.001.

