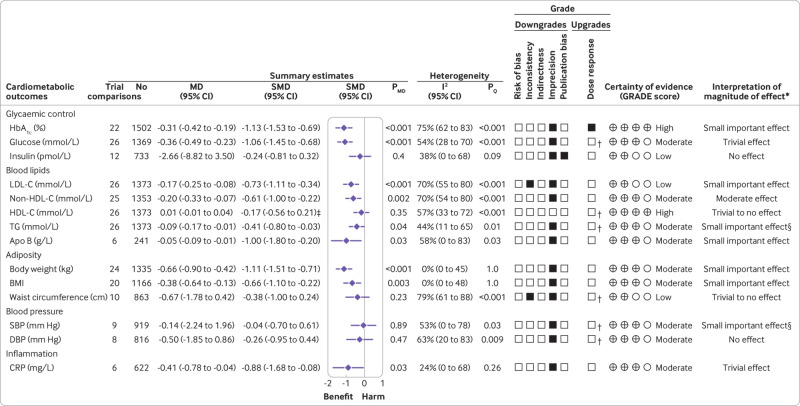
Fig 2.
Summary plot of the effect of low glycaemic index/glycaemic load dietary patterns on glycaemic control and cardiometabolic outcomes in randomised controlled trials in diabetes. Data are expressed as weighted mean differences with 95% confidence intervals using the generic inverse variance method modelled by random effects meta-analyses. To allow the pooled effect estimates for each end point to be displayed on the same axis, mean differences were transformed to standardised mean differences (SMDs). Pseudo-95% confidence intervals for each transformed SMD were derived directly from the original mean difference and 95% confidence intervals. Between study heterogeneity was assessed by the Cochran Q statistic, where P<0.10 is considered statistically significant, and quantified by the I2 statistic, where I2 ≥50% is considered evidence of substantial heterogeneity.51 The grading of recommendations, assessment, development, and evaluation (GRADE) of randomised controlled trials are rated as “high” certainty of evidence and can be downgraded by five domains and upgraded. The filled black squares indicate downgrade or upgrade for each outcome. *For interpretation of the magnitude, we used the minimally important differences for each outcome and dose-response analyses to assess the importance of magnitude of our point estimate using the effect size categories according to new GRADE guidance (see supplemental methods and supplemental tables S5 and S10). †Not upgraded for dose-response (see supplemental table S10 for details). ‡Owing to the difference in directionality of high density lipoprotein cholesterol compared with the other outcomes with regards to signal for benefit or harm, the sign for the SMD was changed. §The interpretation of the magnitude of the effect was based on the positive linear dose-response gradient (see supplemental table S10 for details). To convert blood glucose to mg/dL, multiply by 18.02; LDL-C, non-HDL-C, and HDL-C to mg/dL, multiply by 38.67; to convert triglycerides to mg/dL, multiply by 88.57; to convert CRP to nmol/L, divide by 9.52. Apo B=apolipoprotein B; CI=confidence interval; CRP=C reactive protein; DBP=diastolic blood pressure; HbA1c=glycated haemoglobin; HDL-C=high density lipoprotein cholesterol; LDL-C=low density lipoprotein cholesterol; MD=mean difference; non-HDL-C=non-high density lipoprotein cholesterol; PMD=P value of the mean difference; PQ=P value of the heterogeneity; SBP=systolic blood pressure; SMD=standardised mean difference; TG=triglycerides

