Fig. 5.
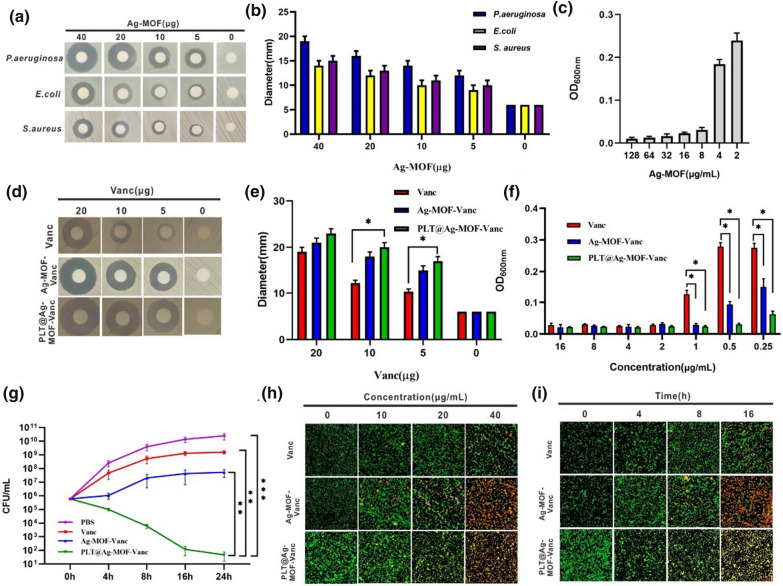
In vitro antibacterial effect of Ag-MOF-Vanc. a Inhibition zones and b corresponding inhibition zone diameters of Ag-MOF against different bacteria. c Concentration effects of Ag-MOF on the growth of MRSA. d Inhibition zones, e corresponding inhibition zone diameters and f concentration effects of Vanc, Ag-MOF-Vanc and PLT@Ag-MOF-Vanc against MRSA. g CFU of MRSA treated with 0.5 µg/mL of different drugs. h CLSM imaging of death/live staining after exposing MRSA to varying concentrations of Vanc, Ag-MOF-Vanc or PLT@Ag-MOF-Vanc. i CLSM imaging of death/live staining after MRSA exposure to Vanc, Ag-MOF-Vanc or PLT@Ag-MOF-Vanc with different incubation time. Scale bar: 20 μm. Data are presented as means ± SD (n = 3).* p < 0.05, **p < 0.01, ***p < 0.001

