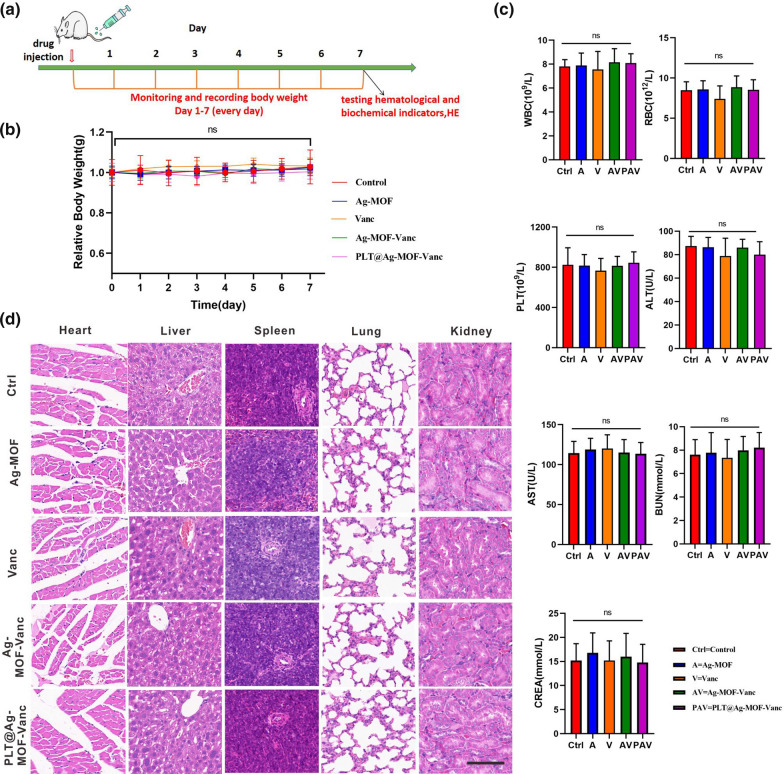
Fig. 9.
In vivo toxicity assessment of PLT@Ag-MOF-Vanc. a Schematic diagram of in vivo toxicity experimental design. b Mice weight changes after injecting with normal saline, Ag-MOF, vancomycin, Ag-MOF-Vanc, and PLT@ Ag-MOF-Vanc during 1 week. c CBC and serum indexes in mice at 1 week after intravenous injection of corresponding drugs. d Histological images of heart, liver, spleen, lung, and kidney samples from mice at 1 week after intravenous injection of corresponding drugs. Scale bar: 100 μm. Control: mice treated with normal saline. Data are indicated as mean ± SD (n = 5). Ns = no significance

