
Figure 5.
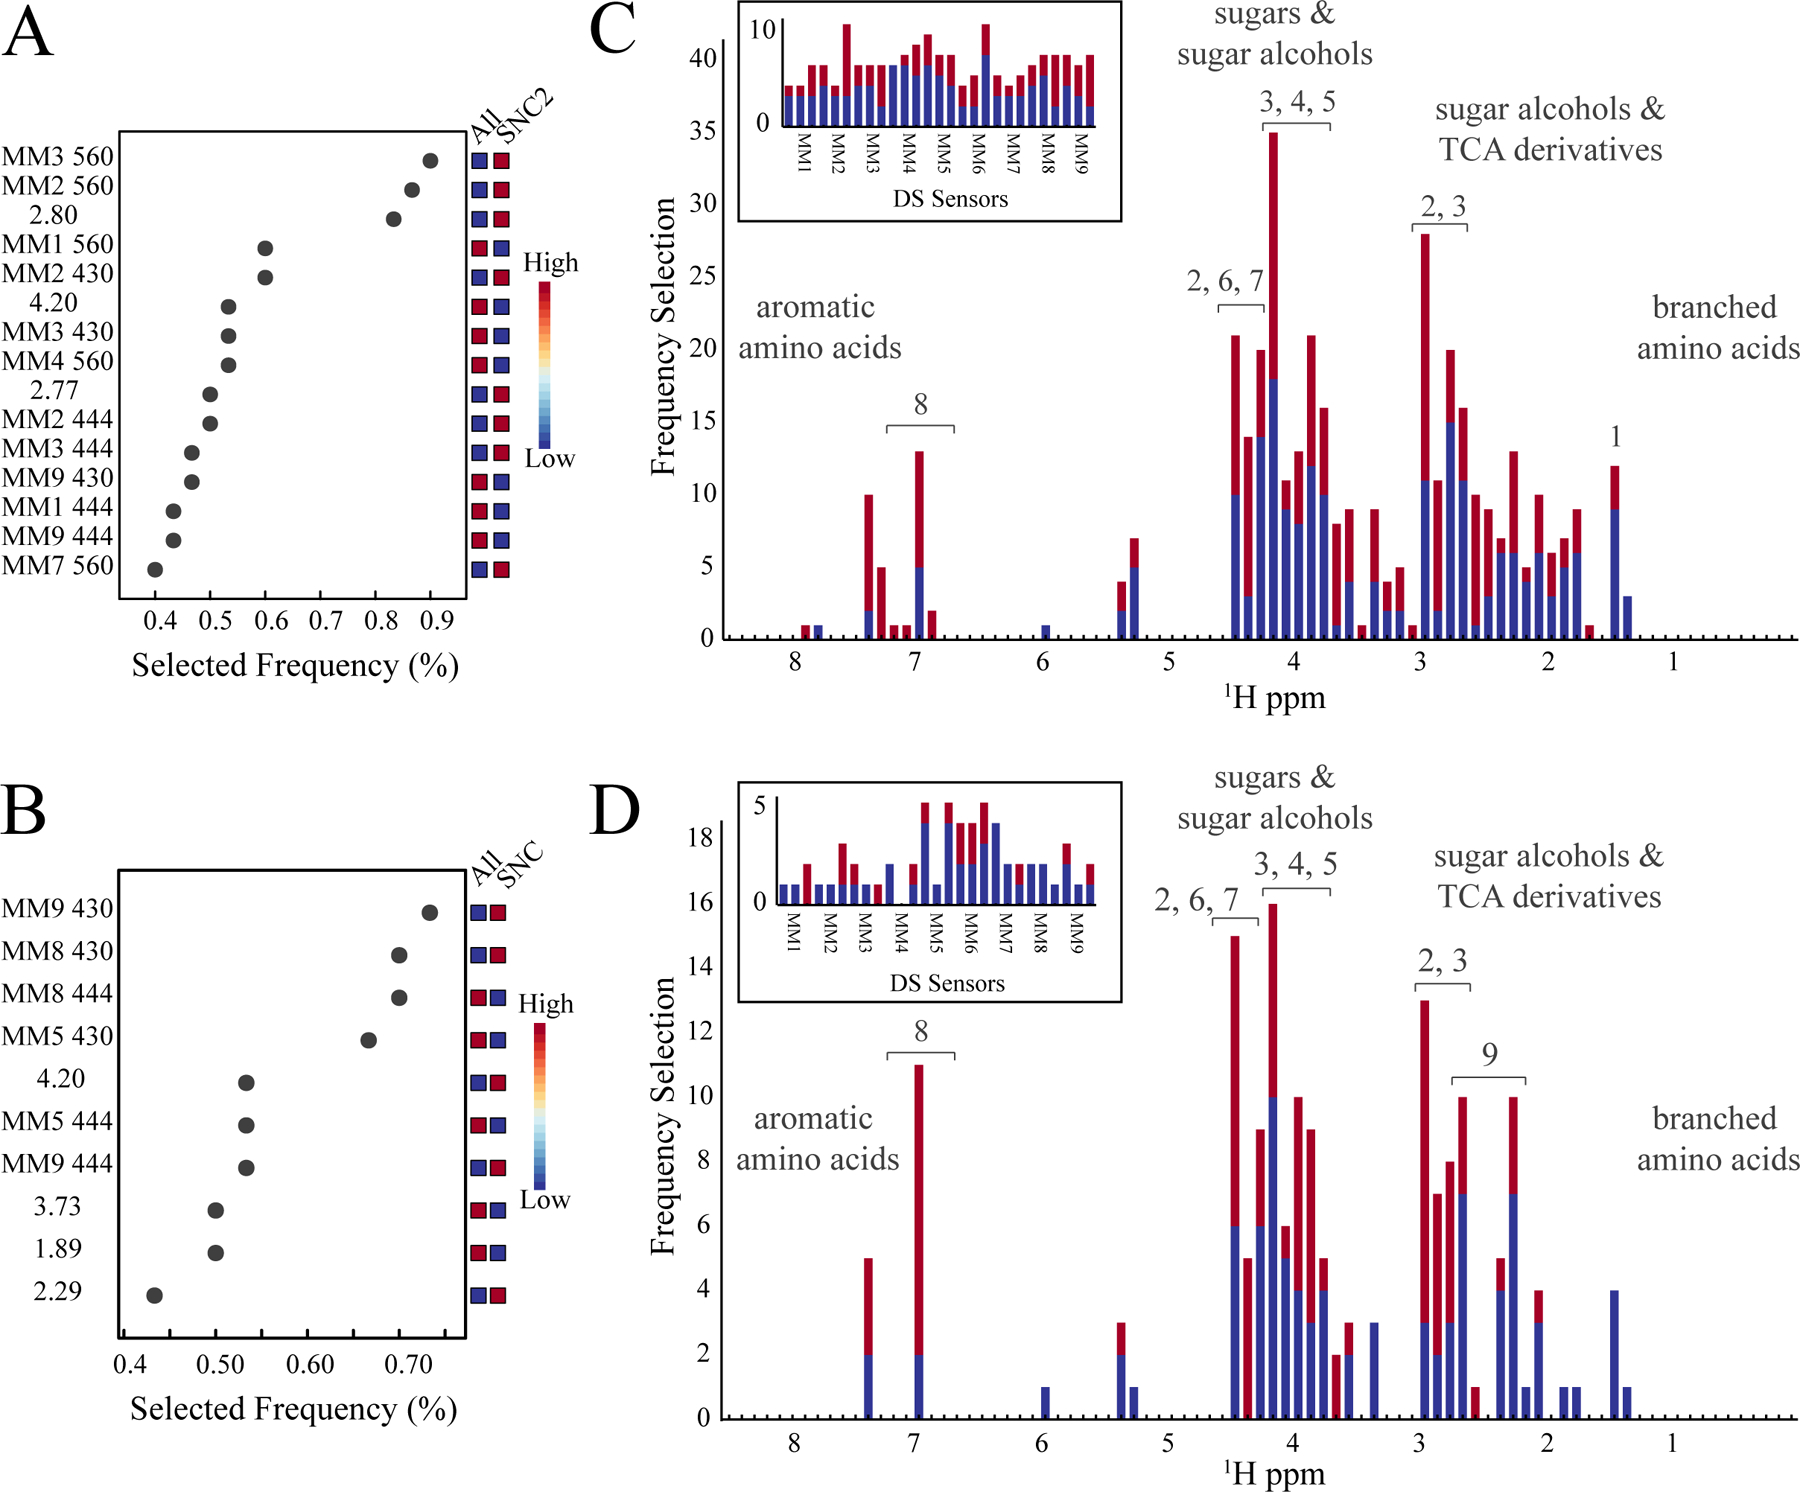
ROC Curve Analysis and Feature Selection Frequency. Representative ROC curve feature selection charts from the combined NMR spectroscopy and DS array dataset for the (A) 2105 SNC2 vineyard analysis and (B)2015 SNC region analysis. The ROC curves were generated with MetaboAnalyst 4.0 (https://www.metaboanalyst.ca/) (Xia et al., 2015). NMR feature usage from all of the ROC curves is plotted using an NMR bin (ppm) size of 0.1 ppm for (C) vineyard and (D) region analysis. 2015 data are colored blue, and the 2016 data is colored red. A plot of the DS array feature (MM1 to MM9) usage from the same ROC curve analyses are displayed as an insert. Putative metabolite assignments correspond to 1, isobutanol; 2, malic acid; 3, phenethyl alcohol; 4, mannitol; 5, fructose; 6, ethyl acetate; 7, ethyl lactate; 8, tyrosine; and 9, citric acid.