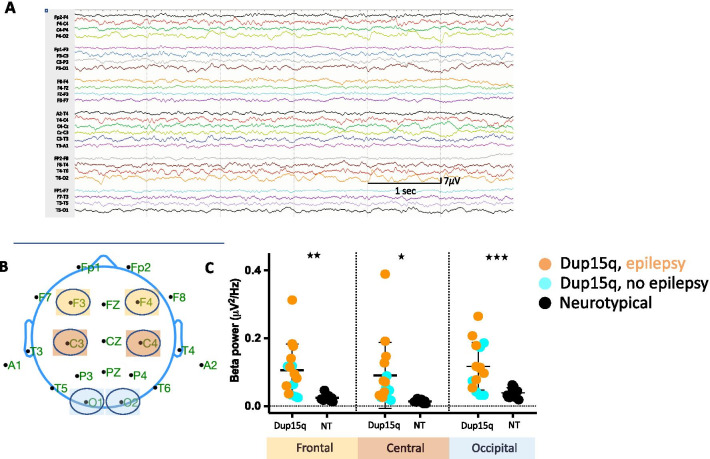
Fig. 3.
Elevated beta power in sleep in children with Dup15q syndrome. 6 s of continuous sleep EEG recording from a 19-month-old Dup15q participant (A). A scalp map showing standard 10–20 EEG electrode placements on the scalp, with channel groups of interest highlighted (frontal: yellow, central: red and occipital: blue) (B). Dot plots of absolute beta power (12–30 Hz) averaged across overnight sleep EEG, in the Dup15q syndrome group (turquoise: participants with no epilepsy, orange: participants with epilepsy) and the NT group (black), plotted for each channel group (C)

