Figure 1.

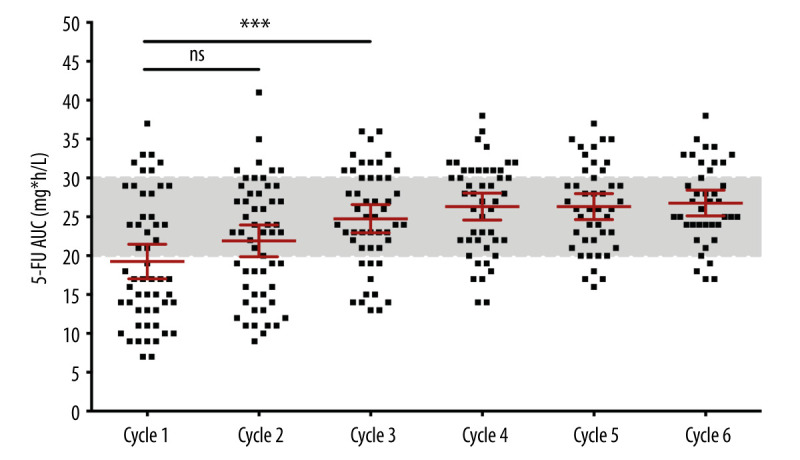
Distribution of measured 5-FU exposure (AUC) in every cycle of the Study Group. The AUC mean of the third cycle was significantly increased compared to the one at the first cycle (P=0.006).

Distribution of measured 5-FU exposure (AUC) in every cycle of the Study Group. The AUC mean of the third cycle was significantly increased compared to the one at the first cycle (P=0.006).