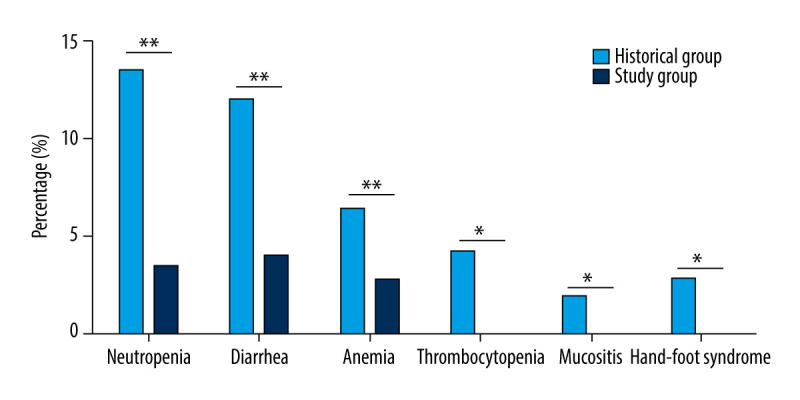
Figure 3.

Incidence rate of severe adverse events (Grade 3 and 4) between the Study Group and the Historical Group. ** P<0.01 represents statistical difference

Incidence rate of severe adverse events (Grade 3 and 4) between the Study Group and the Historical Group. ** P<0.01 represents statistical difference