
Fig. 2.
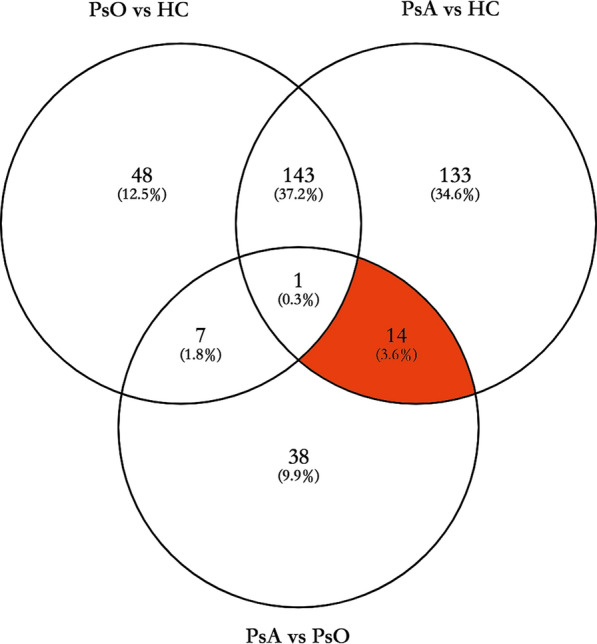
Venn diagram depicted the overlapping of significantly expressed proteins in the three datasets (PsO group versus HC group, PsA group versus HC group, PsA group versus PsO group). The red section included 14 proteins (protein SIRT2, NAA50, ARF6, ADPRHL2, SF3B6, SH3KBP1, UBA3, SCP2, RPS5, NUDT5, NCBP1, SYNE1, NDUFB7, HTATSF1) that met the criteria: (1) in the overlapping section of “PsA vs. HC” and “PsA vs. PsO”; (2) not in the section of “PsO vs. HC”