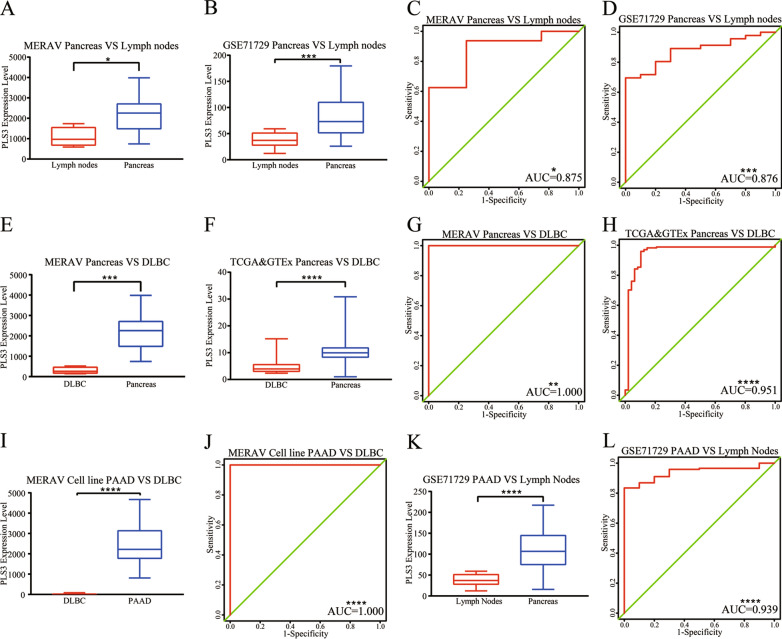
Fig. 8.
Diagnostic value of PLS3 in PDA and pancreas vs. lymph nodes and DLBCL. A, B Level of PLS3. PLS3 was significantly higher in the normal pancreas than in the lymph nodes in the MERAV and GSE71729 datasets. C, D ROC curves of PLS3 in the MERAV and GSE71729 datasets. E, F Level of PLS3. PLS3 was significantly higher in normal pancreas than in DLBCL in the MERAV, TCGA, and GTEx datasets. G, H ROC curves for PLS3 in the MERAV, TCGA, and GTEx datasets. I Level of PLS3. PLS3 expression was notably higher in PDA than in DLBCL in the cell-line data from the MERAV. J ROC curve of PLS3 in the cell line data. K PLS3 level in GSE71729. PLS3 expression was higher in PDA than in lymph nodes. L ROC curve of PLS3 in GSE71729. PDA pancreatic ductal adenocarcinoma, MERAV Metabolic Gene Rapid Visualizer, ROC receiver operating characteristic curve, DLBCL diffuse large B-cell lymphoma, TCGA The Cancer Genome Atlas, GTEx Genotype-Tissue Expression; ****P < 0.0001, ***P < 0.001, **P < 0.01, and *P < 0.05, analyzed by Student’s t-test

