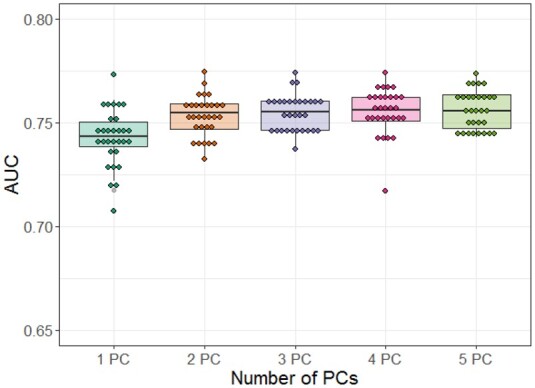
Fig. 4.

Performance comparison of convolutional neural network models. The different size of pathway image was assessed with the top one principal component through five principal components in the generation of pathway images. PC, principal component; AUC, area under the curve
