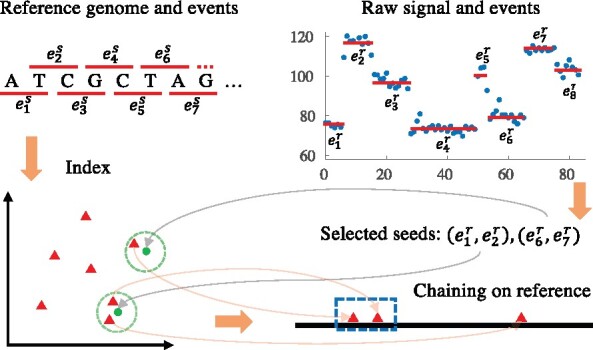
Fig. 1.

Overview of the proposed algorithm. The reference genome is first converted to a sequence of events (red lines) using the expected current value of each k-mer in the pore model. For simplicity of illustration, we use 2-mers in this example. Now every pair of consecutive events is a point in 2D space, thus a spatial index for these points (red triangles) can be created. For visualization purpose, we set dimension to 2, but higher dimensions may be used. In the mapping stage, raw signals (blue dots) are first segmented into events (red lines). Then seeds are selected to query the index with range search and hits on the reference are chained to get the mapping (in the blue rectangle)
