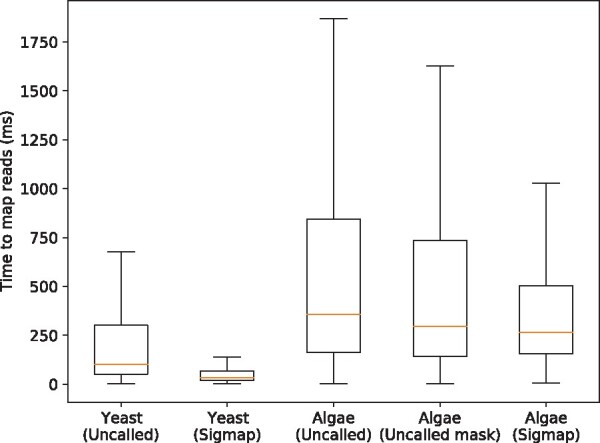
Fig. 2.

Boxplots showing the mapping time distributions of Uncalled and Sigmap on mapping real reads in D2 and D3. Center lines denote the median, box limits are the quartiles and the whiskers extended from the boxes represent 5% and 95% confidence intervals
