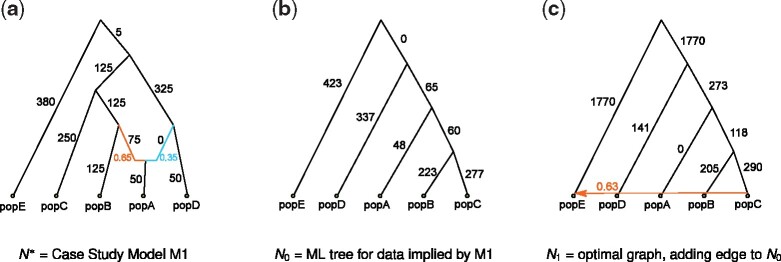
Fig. 1.
Subfigure (a) shows the model admixture graph discussed in Section 3. We refer to this model as M1, and let denote the vector of f2-statistics implied by this model. Subfigure (b) shows N0: the ML (and NJ) tree for rooted at the outgroup E. Subfigure (c) shows N1: the ML network in the edge addition neighborhood of N0. Although has the highest likelihood of all networks with one admixture node, TreeMix and related STB-ML methods get stuck in a local optimum, returning N1. Numerical parameters shown in subfigure (b) and (c) were computed using TreeMix. Log-likelihood scores, also computed using TreeMix, of N0, N1 and are −1 302 625, −366 944 and 83, respectively. Branch lengths are shown multiplied by 1000

