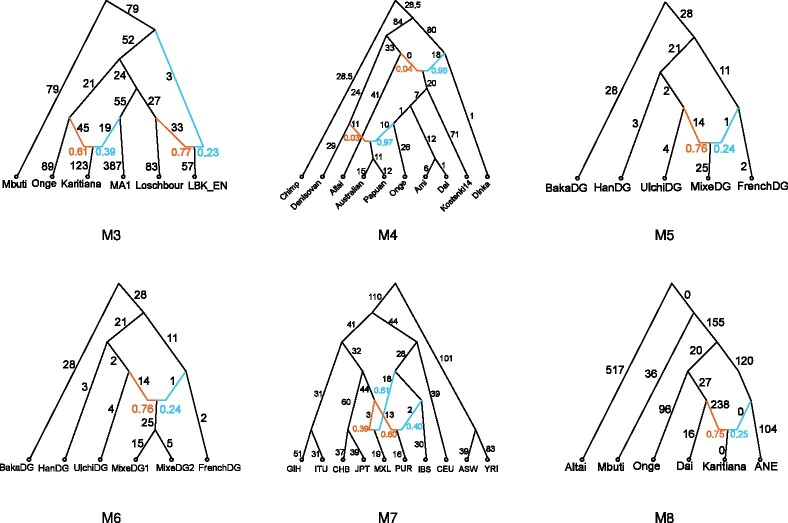
Fig. 3.
This figure shows the model demographies evaluated in our experimental study. M3 is based on Figure S8.1 from Haak et al. (2015), M4 is based on Figure S11.1 from Mallick et al. (2016) but simplified so that there are only two admixture events, M5 is based on Figure 5a from Lipson (2020), M6 is M5 but extended so that Mixe split into two populations, M7 is based on Figure 7a from Wu (2020) and M8 is based on Figure 2 from Yan et al. (2020). All of these admixture graphs were estimated from biological datasets. Note that the branch lengths in these subfigures are not drawn to scale and are shown multiplied by 1000

