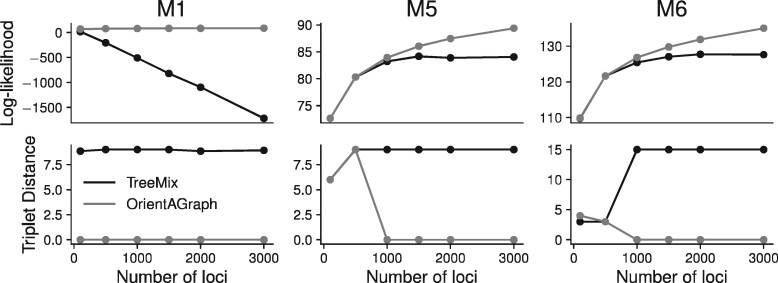
Fig. 4.
Results from simulated data ranging from 100 loci to 3000 loci. Note that we are showing averages across runs of TreeMix for each population order (120 combinations for M1 and M5 and 720 combinations for M6). On these datasets, the results are consistent across runs so we only show the average. While we show both log-likelihood and triplet distance, we do not expect these measures to be fully correlated (i.e. lower triplet score may not imply lower log-likelihood.)

