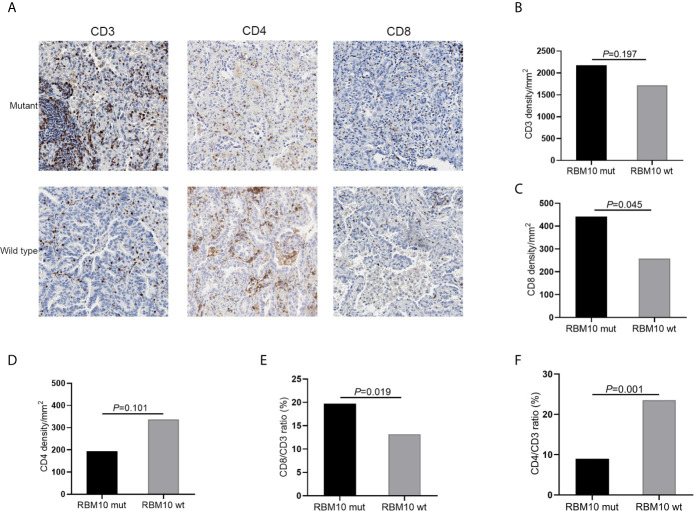
Figure 5.
IHC analyses of T cell infiltration in FFPE tumor samples of GGN cohort. (A) Representative images of CD3, CD4 and CD8 immunostaining. (B–D) CD3+T cell density (B) and CD8+T cell density (C) are higher in the RBM10 mutant LUADs, and CD4+T cell density is lower in the RBM10 mutant group (D). (E, F) CD8/CD3 ratio is higher in RBM10 mutant group than in the wild-type group (E), and CD4/CD3 ratio is lower (F).

