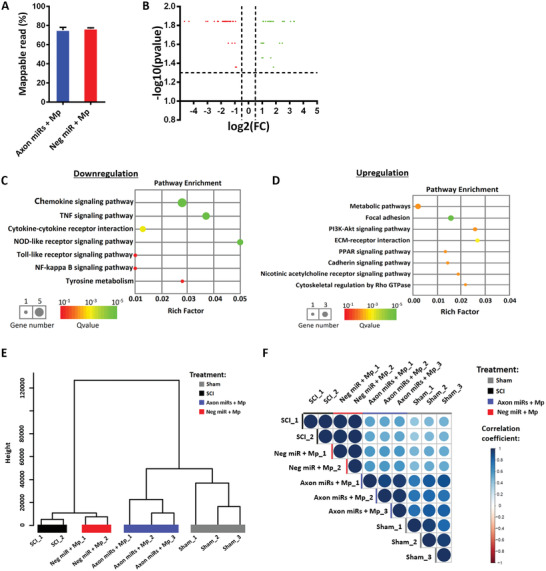
Figure 5.

Treatment with Axon miRs in the presence of methylprednisolone decreased the expression of pro‐inflammatory related genes and enhanced genes related to ECM deposition. A) The mappable reads in Axon miRs + Mp‐ (n = 3) and Neg miR + Mp‐treated (n = 2) groups are similar. B) Volcano plot of DEGs in Axon miRs + Mp‐ and Neg miR + Mp‐treated groups. Red dots represent the downregulated genes, and green dots represent the upregulated genes in Axon miRs + Mp‐treated samples versus Neg miR + Mp‐treated samples. Significant DEGs have fold change of ±1.5, and p‐value ≤ 0.05. C,D) KEGG pathway enrichment of the downregulated and upregulated genes, respectively. The rich factor was calculated by the number of significantly regulated genes in a certain pathway divided by the number of all background genes in that pathway. E) Hierarchical clustering of samples based on their overall gene expression profiles. Segregation of Axon miRs + Mp‐treated samples with Sham samples, and Neg miR + Mp‐treated samples with SCI samples were observed. F) Transcriptome correlation plot of all samples, where the extent of positive correlation between replicates is indicated by the extent of dark blue shading and large circle size. Results indicate good correlation between Axon miRs + Mp‐treated rats and Sham samples.
