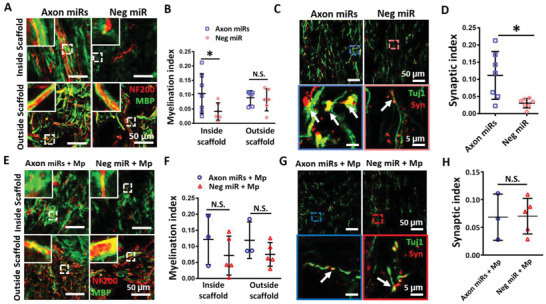
Figure 6.

Axon miRs treatment alone enhanced myelination and synapse formation but may have less impact in the presence of methylprednisolone. A) Representative fluorescent images of NF200 and MBP staining in Axon miRs‐ and Neg miR‐treated rats. The insets at top left corners show the enlarged images of the boxed area from the low magnification images. B) Quantification analysis of myelination index at both inside the scaffold and the tissue‐scaffold interface (i.e., both rostral and caudal). Results suggest that treatment with Axon miRs significantly promoted myelination inside the scaffold. *: p < 0.05, Student's t‐test between Axon miRs and Neg miR group for all regions. N = 7 in Axon miRs group and N = 6 in Neg miR group. C) Representative fluorescent images of Tuj1 and synaptophysin staining in Axon miRs‐ and Neg miR‐treated rats. Images in the second row show the enlarged images of the boxed region in the low magnification images in the first row. D) Quantification analysis of synaptic index inside the scaffold in both Axon miRs‐ and Neg miR‐treated rats. Data suggest that treatment of Axon miRs significantly promoted synapse formation. *: p < 0.05, Student's t‐test between Axon miRs and Neg miR group. N = 7 in each group. E) Representative fluorescent images of NF200 and MBP staining in Axon miRs + Mp‐ and Neg miR + Mp‐treated rats. The insets at top left corners show the enlarged images of the boxed area from the low magnification images. F) Quantification analysis of myelination index at both inside the scaffold and the tissue‐scaffold interface (i.e., both rostral and caudal). Data indicate that in the presence of methylprednisolone, treatment with Axon miRs did not enhance myelination both inside and outside the scaffold versus Neg miR treatment. Student's t‐test between Axon miRs + Mp and Neg miR + Mp group for all regions. These results are also not significantly different when compared with corresponding samples without methylprednisolone (Figure 6B). N = 3 in Axon miRs + Mp group and N = 5 in Neg miR + Mp group. G) Representative fluorescent images of Tuj1 and synaptophysin staining in Axon miRs + Mp‐ and Neg miR + Mp‐treated rats. Images in the second row show the enlarged images of the boxed region in the low magnification images in the first row. H) Quantification analysis of synaptic index inside the scaffold. Data indicate that in the presence of methylprednisolone, treatment of Axon miRs did not enhance synapse formation inside the scaffold versus Neg miR treatment. Student's t‐test between Axon miRs + Mp and Neg miR + Mp group. These results are also not significantly different when compared with corresponding samples without methylprednisolone (Figure 6F). N = 3 in Axon miRs + Mp group and N = 5 in Neg miR + Mp group. All data were represented as mean ± SD.
