
Figure 3.
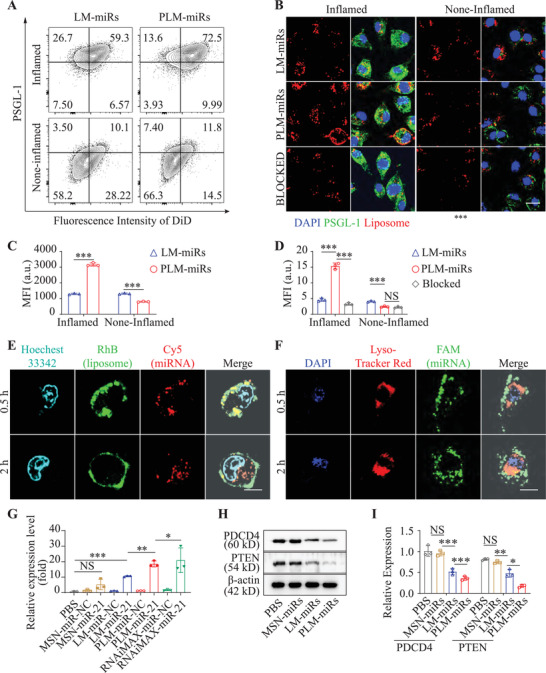
Macrophage targeting ability and cellular internalization of PLM‐miRs in vitro. A) The binding ability of DiD‐labeled LM‐miRs or PLM‐miRs to inflamed (or not) BMDMs was detected by flow cytometry and C) statistically analyzed by FlowJo_V10 software (n = 3). B) The binding of LM‐miRs, PLM‐miRs, and anti‐P‐selectin‐blocked PLM‐miRs to inflamed (or not) BMDMs were imaged after staining with PSGL‐1 and D) further quantified by ImageJ (n = 3). Red, DiD labeled nanoparticles; Green, PSGL‐1. Scalar bar, 10 µm. E,F) CLSM images of inflamed BMDMs incubated with E) RhB (on liposome, green), Cy5 (on miRNA, red) double labeled PLM‐miRs or F) FAM (on miRNA, green)‐labeled PLM‐miRs for 0.5 and 2 h. Scalar bar, 10 µm. Nucleus were stained with Hoechest 33 342 (cyan) in (E). Lysosomes were stained with Lyso‐Tracker Red (red) and cell nucleus with DAPI (blue) in (F). G) Real‐time RT‐qPCR analysis of the expression of miR‐21 in recipient cells after different treatments (n = 3). H) Western blot analysis of the protein levels of PTEN and PDCD4 and was further quantified in (I) by ImageJ (n = 3). Results are presented as mean ± SD. NS P > 0.05, *P < 0.05, **P < 0.01, ***P < 0.001.