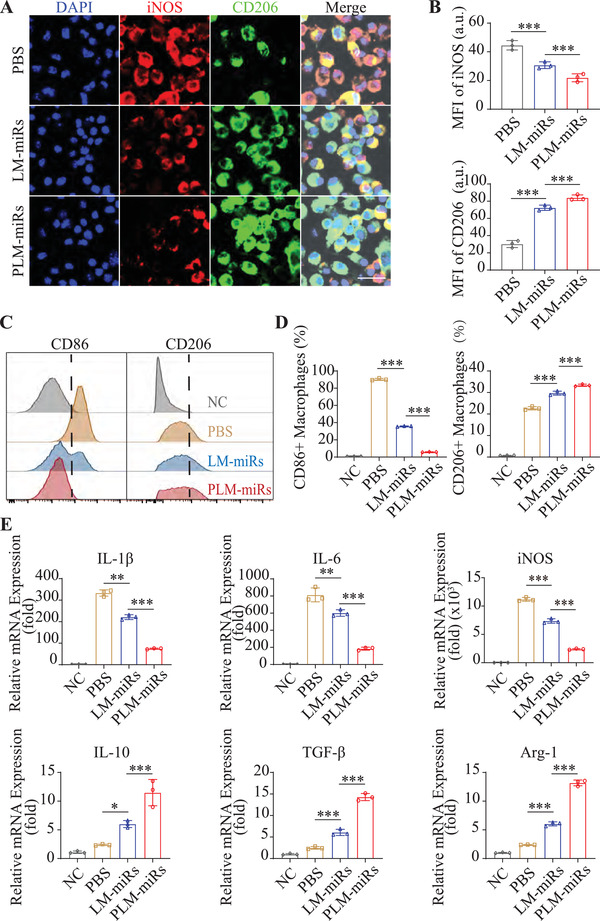
Figure 4.

PLM‐miRs reprogram inflamed BMDM to M2 phenotype in vitro. A) CLSM images indicating phenotypes of inflamed BMDMs after treated by PBS, LM‐miRs or PLM‐miRs. Scalar bar, 20 µm. B) MFI quantification of iNOS (M1) and CD206 (M2) in (A) (n = 3). C) Flow cytometry assay and D) statistical analyze of the polarization of inflamed BMDMs after treated by PBS, LM‐miRs, or PLM‐miRs (n = 3). M1 and M2 subtypes were indicated by CD86 and CD206, respectively. E) Real‐time RT‐qPCR analysis of the expression levels of M1 markers (IL‐1β, IL‐6, iNOS) and M2 markers (IL‐10, TGF‐β, Arg‐1) in inflamed BMDMs after treated by PBS, LM‐miRs, or PLM‐miRs (n = 3). Results are presented as mean ± SD. NS P > 0.05, *P < 0.05, **P < 0.01, ***P < 0.001.
