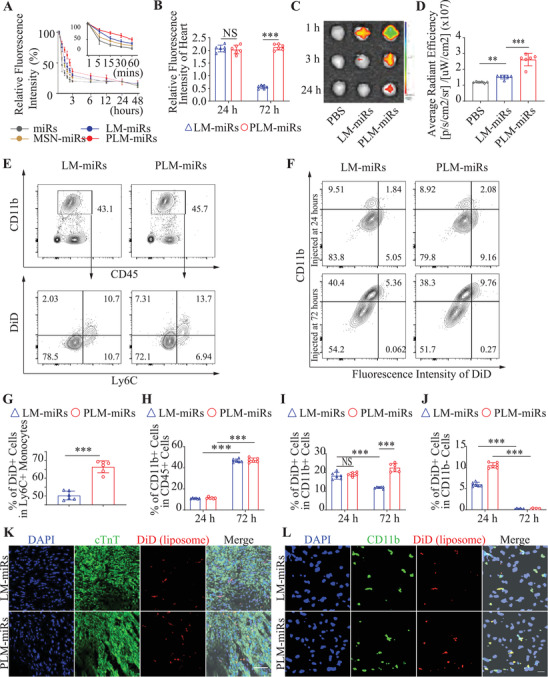
Figure 5.

Biodistribution and targeting specificity of PLM‐miRs in vivo. A) Circulation profiles of miRs, MSN‐miRs, LM‐miRs, and PLM‐miRs in healthy mice after intravenous injection (n = 6). B) RFI of heart tissue homogenate after treated with DiD (on liposome) labeled LM‐miRs or PLM‐miRs at 24 or 48 h post injury (n = 6). C) IVIS images of three timepoints (1, 3, 24 h) of LM‐miRs or PLM‐miRs accumulated in the hearts after i.v. injected in MI/R mice and D) were further quantified the data of the first time point (n = 6). E) Flow cytometry analysis of the binding ability of PLM‐miRs to Ly6C+ monocytes in the blood circulation after intravenous injection at 72 h post‐MI and G) was further quantified (n = 6). F) Flow cytometry and statistical analysis of H) CD11b+, I) CD11b+DiD+, and J) CD11b+DiD‐ cells isolated from MI/R induced murine hearts after exposure to either LM‐miRs or PLM‐miRs injected at 24 or 72 h post‐MI (n = 6). K) CLSM images of heart sections showing the accumulation of LM‐miRs and PLM‐miRs after immuno‐stained with cardiac troponin T (cTnT). Red, DiD (on liposome) labeled nanoparticles; Green, TnT. Scalar bar, 50 µm. L) CLSM images of heart sections showing the colocalization between monocytes/macrophages and LM‐miRs or PLM‐miRs after immuno‐stained with CD11b. Red, DiD (on liposome) labeled nanoparticles; Green, CD11b. Scalar bar, 20 µm. Results are presented as mean ± SD. NS P > 0.05, *P < 0.05, **P < 0.01, ***P < 0.001.
