
Figure 3.
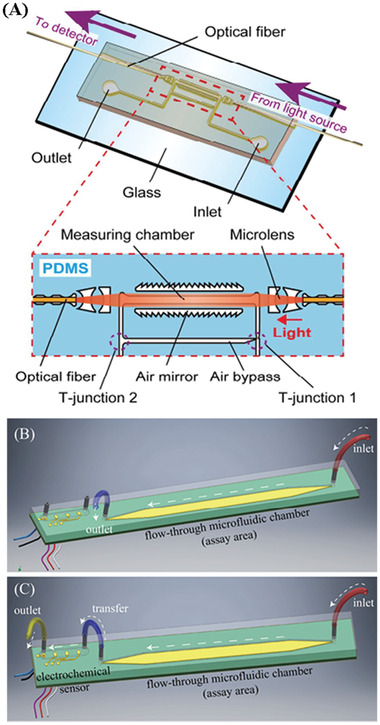
Schematic illustration of A) The PhLoC with integrated optical and microfluidic components. Reproduced with permission.[ 112 ] Copyright 2016, American Chemical Society. B) A 3D graphical representation of the unit cell fluidic arrangement during the initial phase of the assay. C) A 3D graphical representation of the unit cell fluidic arrangement during the second phase of the assay, detailing fluidic ports and connections between assay area and electrochemical sensor test cartridge of a Proxim handheld instrument. Reproduced with permission.[ 117 ] Copyright 2018, MDPI.