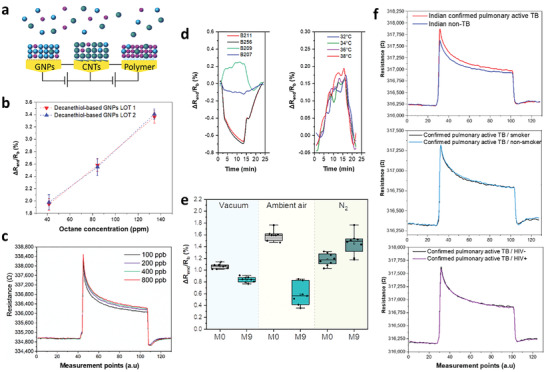
Figure 3.

Sensor array responses. a) Schematic illustration a sensor array. b) Representative responses of decanethiol‐capped GNP sensors from two different batches toward increasing concentrations of octane. c) Representative response of the same sensor to increasing toluene concentration. d) Response rate to 0.6 ppb toluene in nitrogen of sensors based on different thiol ligands at 34 °C (left) and temperature effect on sensor response during decanethiol (B209)‐based GNPs exposure to toluene at 1.2 ppm (right). e) Representative responses of dodecanthiol‐based GNPs toward 1‐Methyl Naphthalene at 272 ppb in nitrogen exposure in different storage conditions at the starting point (M0) and after 9 months (M9). f) Representative signals of the same sensor to confirmed pulmonary active TB and non‐TB skin samples from the clinical site in India as well as confirmed pulmonary active TB with or without smoking habits and HIV infection.
