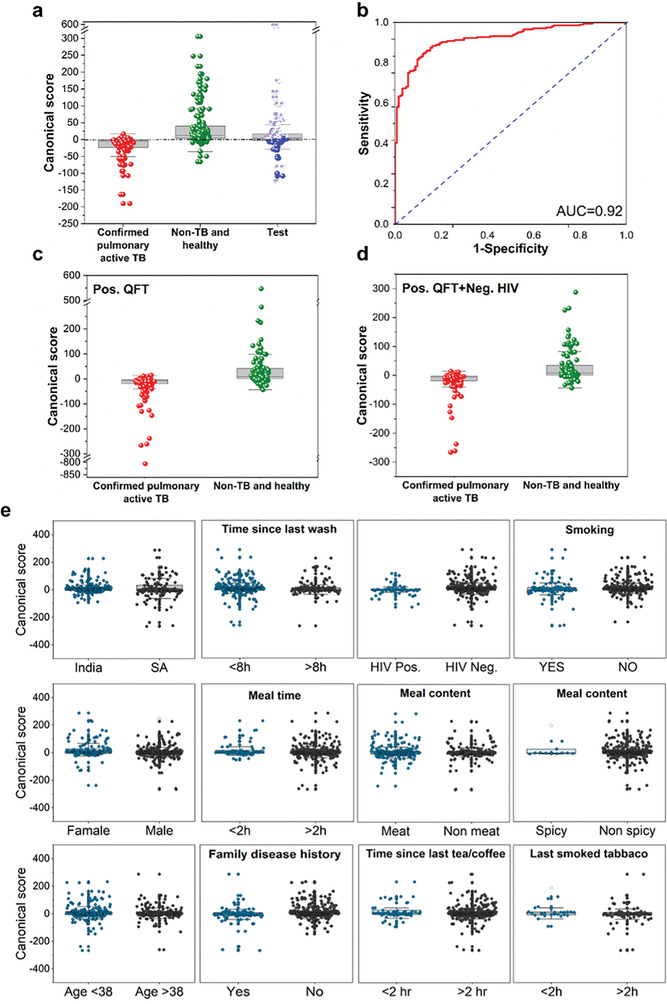
Figure 4.

Quadratic DFA results of the global classifier. a) Boxplot of the canonical score. Each point represents one sample. The central dashed line represents Youden's cut‐point. Samples above the cut‐point are classified as non‐TB and healthy, and samples below it are classified as confirmed pulmonary active TB samples. Non‐TB and healthy samples of the test group are marked as open spheres, whereas confirmed pulmonary active TB samples of the test group are shown as closed spheres. b) Receiver operating characteristic (ROC) curve of the model. c) Boxplot of the canonical score for the subpopulation with QFT positive status. d) Boxplot of the canonical score for the subpopulation with QFT‐positive and HIV‐negative statuses. e) Boxplots of canonical score for confounding factors. QFT‐ QuantiFERON‐TB Gold test.
