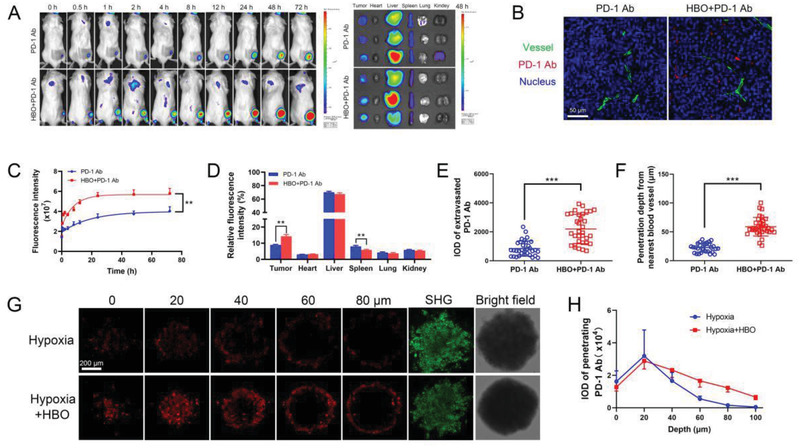
Figure 3.

HBO facilitates PD‐1 Ab delivery. A) In vivo fluorescence imaging of mice after intravenous injection of PD‐1 Ab and ex vivo fluorescence imaging of tumors and major organs 48 h post administrations. B) In vivo penetration of PD‐1 Ab in H22 subcutaneous tumor tissue of different treatments. The scale bar is 50 µm. C) Semiquantification of the fluorescence intensity in tumor site at different time points (n = 5). D) Organ and tumor accumulation of PD‐1 Ab 48 h postinjection (n = 5). E) Average fluorescence intensity of extravasated PD‐1 Ab in tumor tissue (n = 20). F) The penetration depth of PD‐1 Ab from the nearest blood vessel (n = 20). G) Representative penetrated PD‐1 Ab fluorescence images, SHG, and bright field images of 4T1‐SS. H) Average fluorescence intensity of penetrated PD‐1 Ab in 4T1‐SS (n = 3). Error bars indicate SEM. Statistical significance was calculated by t‐test. P‐values: *, P < 0.05; **, P < 0.01; ***, P < 0.001.
