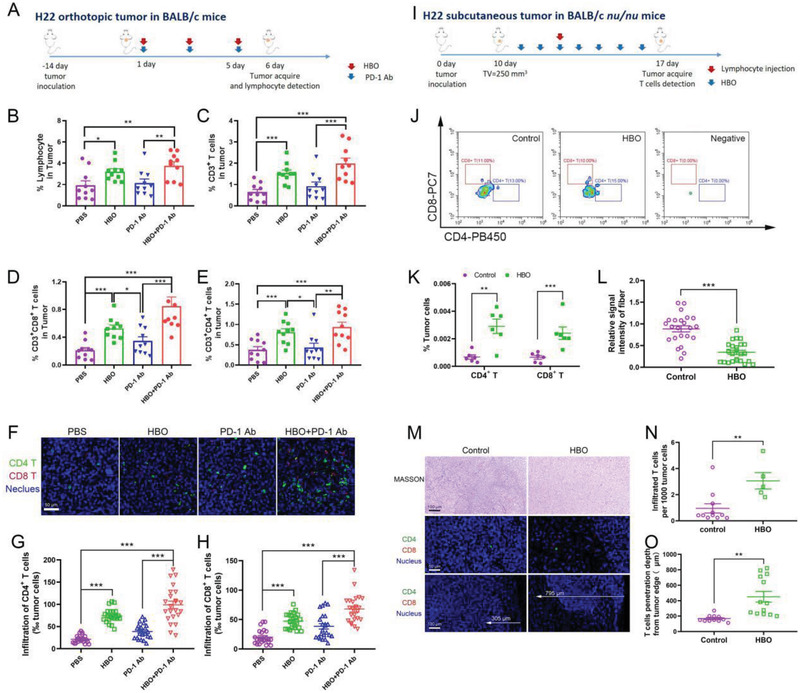
Figure 4.

HBO enhances T cell infiltration into tumor parenchyma. A) Experimental scheme of HBO enabling T cell infiltration in H22 orthotopic tumor‐bearing BALB/c mice. Proportion of infiltrated CD45+ lymphocyte B), CD3+ T cells C), CD8+ T cells D), and CD4+ T cells E) in tumors (n = 10). F) Immunofluorescence staining of CD4+ T cell and CD8+ T cell images. The scale bar is 50 µm. Quantification of CD4+ T cells G) and CD8+ T cells H) in tumor tissue sections (n = 20). I) Experimental procedures of HBO enhancing T cell infiltration in H22 subcutaneous tumor‐bearing BALB/c nu/nu mice. J,K) Infiltrated CD4+ T cells and CD8+ T cells in tumors were detected by flow cytometry (n = 6) after adoptive lymphocytes transfer. M) MASSON staining images, immunofluorescence staining images of T cells (CD4+ and CD8+) of tumor tissue. L) Quantification of collagen in MASSON staining of tumor tissue sections (n = 20). N) Average infiltrated T cells in tumor tissue (n = 20). O) The infiltration depth of T cells from the tumor edge (n = 20). Error bars indicate SEM. Statistical significance was calculated by t‐test. P‐values: *, P < 0.05; **, P < 0.01; ***, P < 0.001.
