Figure 2.

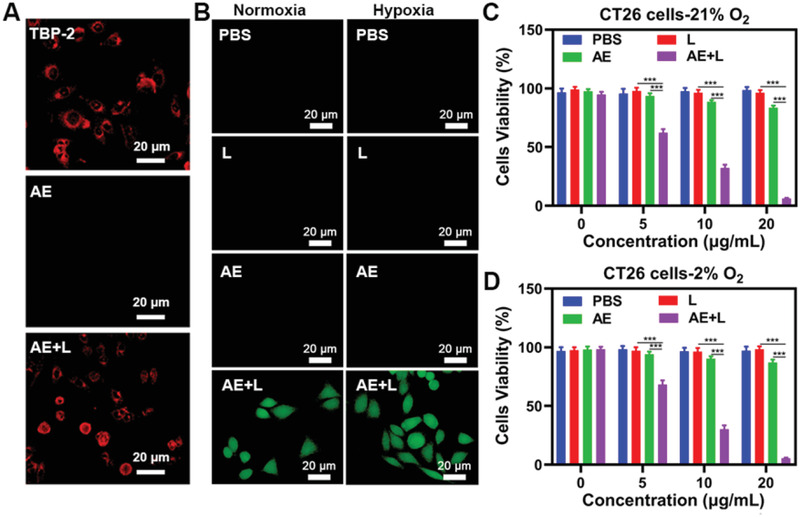
A) CT26 cell fluorescence images following the indicated treatments. λ ex = 488 nm and λ em = 600–700 nm. B) Tumor cells DCFH‐DA fluorescence images were observed after the indicated treatments under normoxia or hypoxia condition. L: white light (0.1 W cm−2, 10 min). C) Under normoxia or D) hypoxic conditions, viability of CT26 tumor cells treated with PBS, L (0.1 W cm−2, 10 min), AE, or AE+L at different TBP‐2 concentrations. *P<0.05, **P<0.01, ***P<0.001; Student's t‐test.
