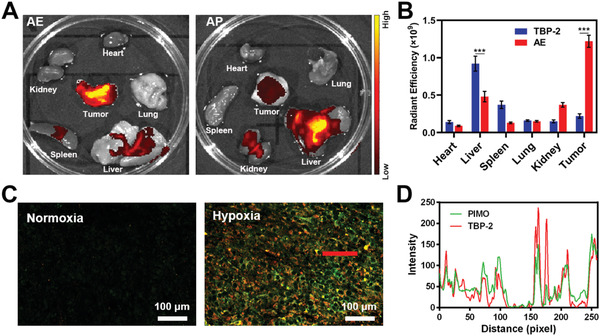
Figure 3.

A) Ex vivo images and B) radiant efficiency in collected tumor tissues and organs in mice bearing orthotopic CT26 tumors at 24h post‐AE or AP injection. C) Fluorescent visualization of AE co‐localization with hypoxic regions. (Green: PIMO, red: TBP‐2). D) The PIMO and TBP‐2 fluorescence distribution profiles along the red line within the hypoxic region marked in Figure 3C. *P<0.05, **P<0.01, ***P<0.001; Student's t‐test.
