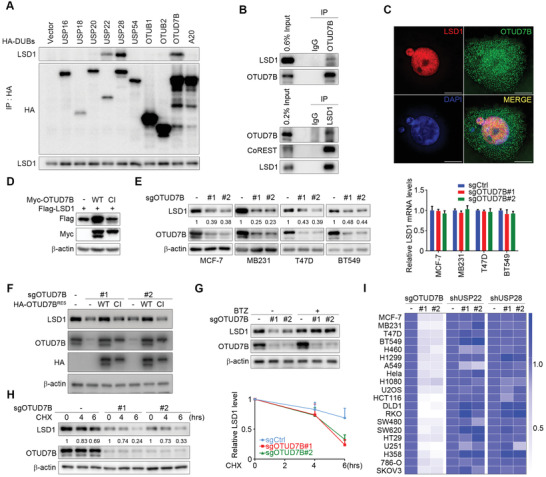
Figure 1.

OTUD7B binds LSD1 and regulates its stability. A) HA‐tagged DUBs were transfected into HEK293T cells, followed by immunoprecipitation (IP) and immunoblotting (IB) as indicated. B) Co‐IP of OTUD7B with LSD1 in MDA‐MB‐231 cells. The immunoprecipitated materials by the indicated antibodies were analyzed by western blotting. C) Colocalization of the indicated proteins by IF staining with the indicated antibodies was visualized by structured illumination microscopy (SIM). Scale bars: 10 µm. D) Flag‐tagged LSD1 was co‐transfected into HEK293T cells with the indicated constructs. Whole cell lysates (WCLs) were subjected to IB analysis. E) Cells were infected with the indicated lentiviruses. Cell lysates and RNA extracts were subjected to IB (left panel) and quantitative real‐time PCR (qRT‐PCR) analysis as indicated (right panel). F) OTUD7B reconstituting MDA‐MB‐231 cells were subjected to IB analysis as indicated. G) MDA‐MB‐231 cells stably expressing the indicated sgRNAs were treated with BTZ (100 × 10−9 m) for 5 h, followed by IB analysis. H) MDA‐MB‐231 cells stably expressing OTUD7B sgRNAs were treated with cycloheximide (CHX, 50 µg mL−1), followed by IB analysis as indicated (left panel). The graph shows the quantification of protein levels (right panel). I) IB analysis of WCL derived from 20 different cancer cells expressing the indicated lentiviral constructs, as shown in (E) and Figures S1J and S2A in the Supporting Information. The heatmap shows the fold change of quantified LSD1 protein levels. Data were presented as mean ± SEM of three independent experiments.
