
Figure 4.
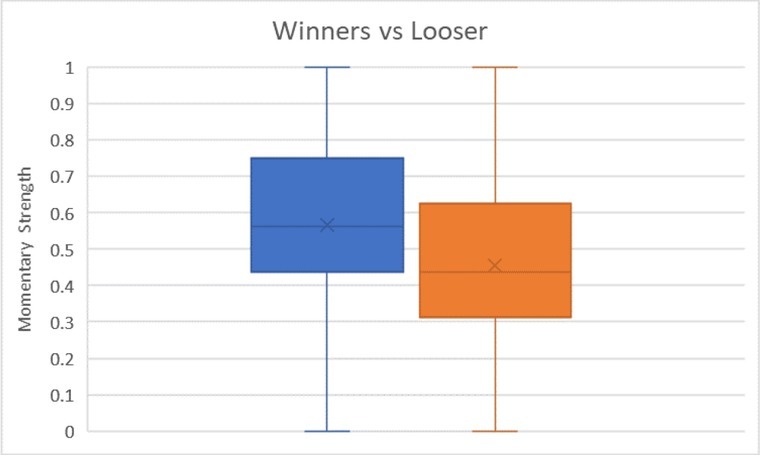
Boxplot of the momentary strengths of all teams in the 96 matches played divided by winners (blue) and losers (orange). The line inside the box represents the median value and the X is the mean value.
Official websites use .gov
A
.gov website belongs to an official
government organization in the United States.
Secure .gov websites use HTTPS
A lock (
) or https:// means you've safely
connected to the .gov website. Share sensitive
information only on official, secure websites.
Boxplot of the momentary strengths of all teams in the 96 matches played divided by winners (blue) and losers (orange). The line inside the box represents the median value and the X is the mean value.