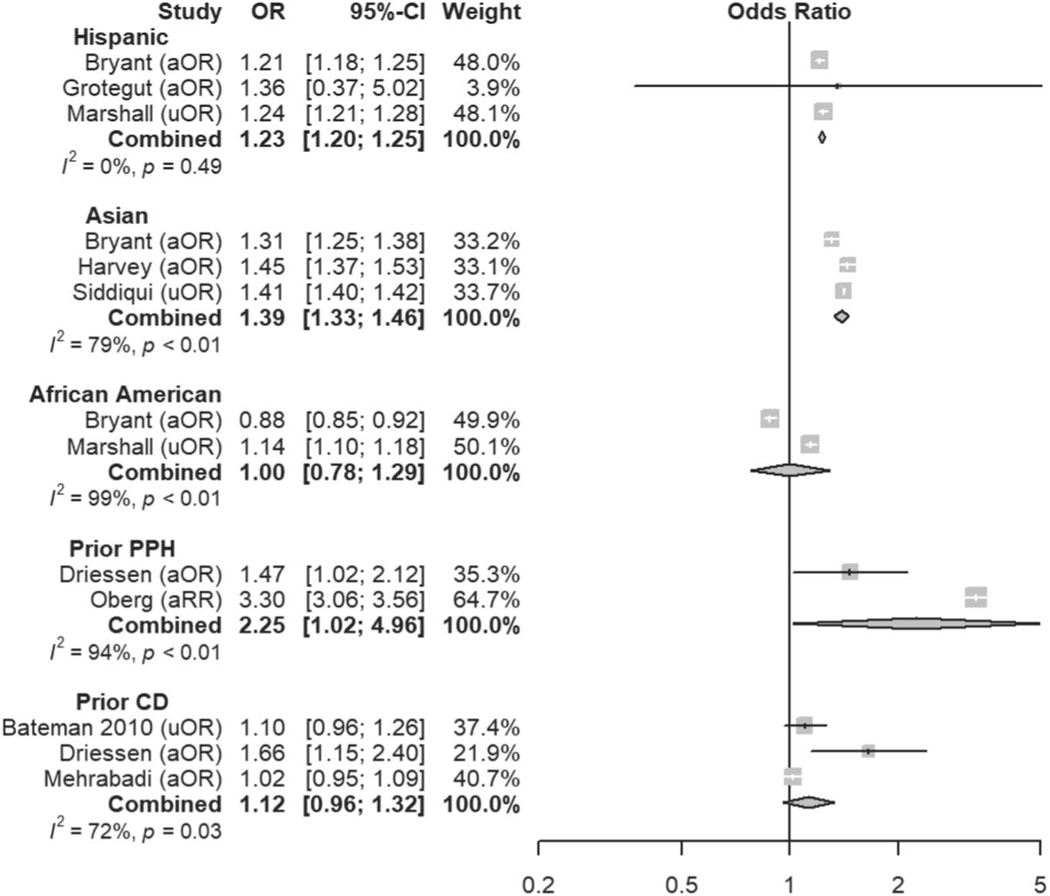
Fig. 3.
Meta-analysis of history and demographic risk factors. Forest plots of odds ratios (ORs) that were included in the quantitative meta-analysis and the associated overall ORs. For each OR, the size of the gray square region is proportional to the corresponding study weight. Diamond-shaped intervals represent the overall ORs. I2 represents the fraction of variability among the individual ORs that cannot be explained by sampling variability. aOR, adjusted odds ratio; uOR, unadjusted odds ratio; aRR, adjusted relative risk; PPH, postpartum hemorrhage; CD, cesarean delivery.
Ende. Atonic Hemorrhage Risk Systematic Review. Obstet Gynecol 2021.

