Figure 1.

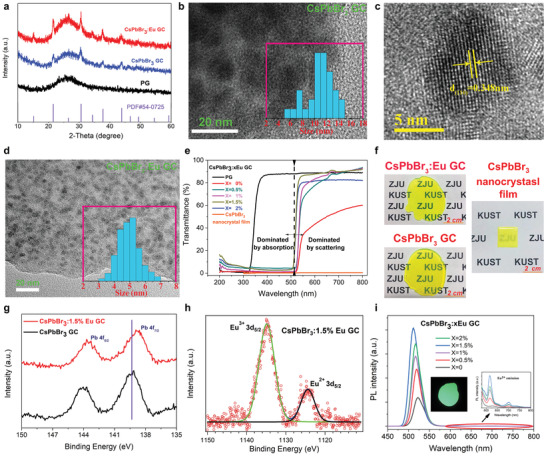
Fabrication and characterization of CsPbBr3 quantum dots (QDs) inside transparent amorphous matrix. a) XRD patterns of precursor glass (PG), CsPbBr3 QDs with and without Eu dopant in GC. b) TEM image of CsPbBr3 QDs without Eu dopant in glass (quantum dot size distribution shown in inset). c) HRTEM image of CsPbBr3 GC. d) TEM image of CsPbBr3:Eu GC (quantum dot size distribution shown in inset). e) Transmittance spectra of CsPbBr3:xEu QDs in glass as a function of Eu concentration (transmittance spectrum of PG measured as a reference). f) Photographs of CsPbBr3 GC, CsPbBr3:1.5%Eu GC (optimal concentration of Eu dopant) and conventional CsPbBr3 nanocrystal film with thickness of about 100 µm (CsPbBr3 nanocrystals and polystyrene are uniformly mixed with the ratio of 1:5). g) Pb 4f XPS spectra of CsPbBr3 GC with and without Eu dopant. h) Eu 3d5/2 XPS spectrum of CsPbBr3:1.5%Eu GC. i) Photoluminescence (PL) spectra of CsPbBr3:xEu GC as a function of Eu concentration under 365 nm UV excitation (photograph of CsPbBr3:1.5%Eu GC emission and enlargement of Eu3+ emission shown in the inset). PL spectra is measured with integrating sphere to ensure fair comparison
