Figure 2.

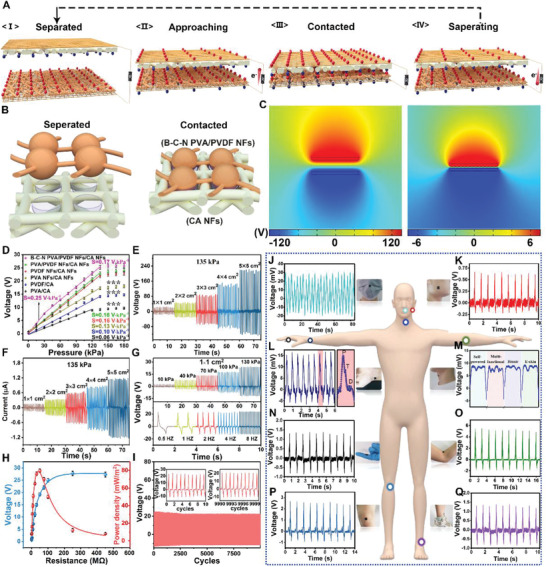
The performance of triboelectric (pressure‐sensing) layer: A) Schematic illustration of the working principle of triboelectric (pressure‐sensing) layer as a TENG. B) Schematic representation of CA NFs and B‐C‐N PVA/PVDF NFs contact separation process. C) Finite element simulation of potential distribution at different separation distances (5 and 0.1 mm) between CA NFs and B‐C‐N PVA/PVDF NFs. D) The output voltage and sensitivity of e‐skin pixels (1 × 1 cm2) with different materials and structure. The variation is represented by the standard deviation of three independent replicates in all graphs, *** (p‐value < 0.05). E,F) Output voltage and current of the triboelectric (pressure‐sensing) layer, with different sizes as a pixel. G) The output voltage of e‐skin pixel (1 × 1 cm2) at different pressures and frequencies. H) The relationship between the output voltage and power density of triboelectric (pressure‐sensing) layer and the external load resistance. I) The output stability of the e‐skin pixel (1 × 1 cm2) was tested at 130 kPa for 10 000 cycles. The internal graph is the signal graphs of the first ten cycles and the last ten cycles. J–Q) Signals of whole‐body monitored using the e‐skin attached to different parts, which are marked by circles in different colors in the human body model.
