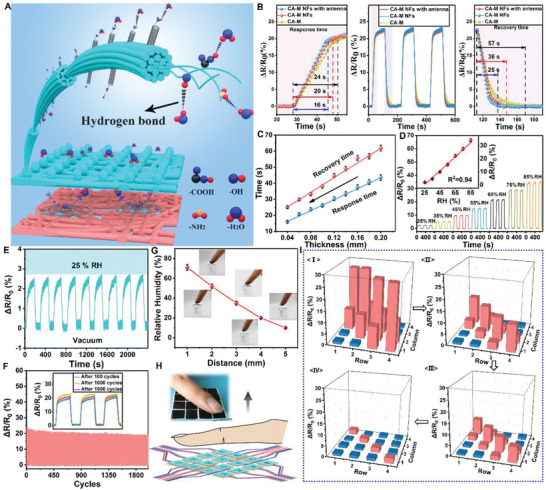
Figure 4.

The sensing performance of e‐skin for humidity at 25 °C: A) The mechanism of humidity‐sensing layer to humidity. B,C) Effects of different structures and thickness on humidity sensitivity of humidity‐sensing layer. D) Response signals of e‐skin at different relative humidity. The internal diagram illustrates the linear relationship between the output signal and RH. E) Nine cycles of e‐skin at different humidity (0–25%). F) The fluctuation of the signals of e‐skin during 2000 cycles at a certain RH (65%). The internal picture is the instantaneous signal of e‐skin after 100, 1000, and 1900 cycles. G) The relationship between the humidity received by the e‐skin and the distance from fingertip. H) The illustration image of fingers gradually moving away from the numbered e‐skin. Inside is an optical image of the experiment. I) The matrix data map corresponds to different distances (1, 2, 3, and 4 mm) in (H).
