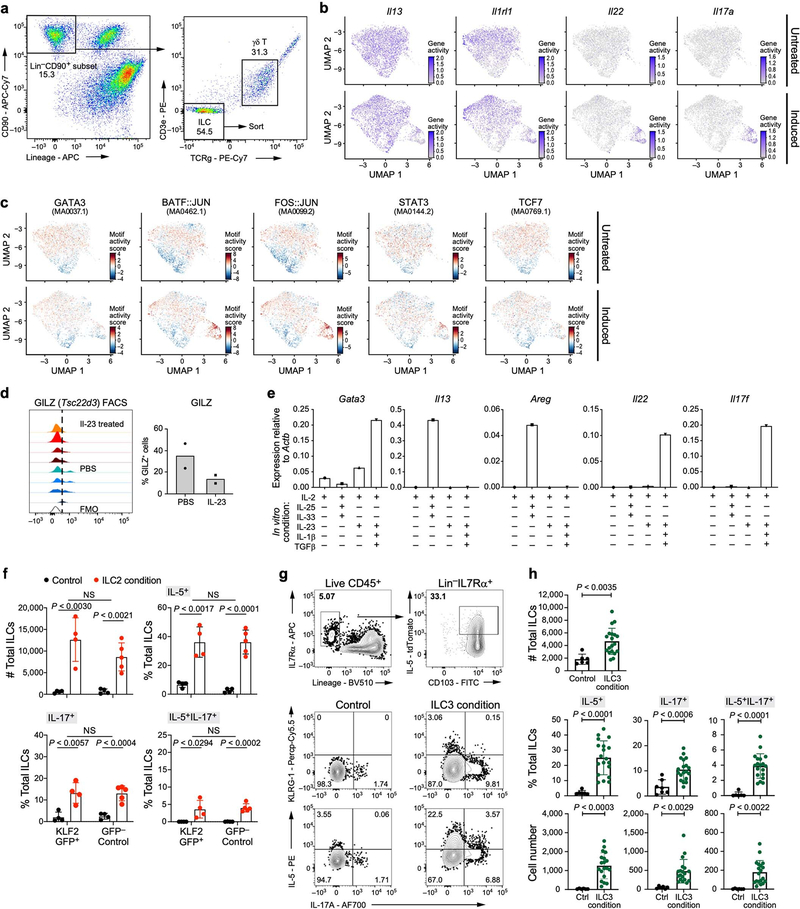
Extended Data Fig. 8. Potential for skin ILCs to transition to ILC3-like states is highlighted by chromatin accessibility and in vitro stimulation.
a–c, Single-cell ATAC-seq profiles reveal accessible chromatin at ILC2-, ILC3- and quiescence-associated loci (Methods). a, Gating strategy on CD45+ cells used to sort total ILCs for scATAC-seq. ILCs are defined as CD90.2+ and lin− (CD4, CD8, TCRβ, CD11b, CD11c, CD19, B220, NK1.1, Ter119, Gr1, FcεRIa), followed by additional exclusion of CD3e+ and TCRγδ+ cells. b, UMAP embedding shows scATAC-seq profiles (dots) from untreated (top) or IL-23-induced (bottom) mice, coloured by chromatin accessibility (colour bar; low, grey; high, violet) at the promoter and gene loci of ILC2 genes (Il13 and Il1rl1) and ILC3 genes (Il22 and Il17a). c, UMAP embedding (as in b) shows profiles from untreated (top) or IL-23–induced (bottom) mice, coloured by motif activity score (colour bar: low, blue; high, red; Methods) for the ILC-associated transcription factors GATA3 (JASPAR motif code: MA0037.1, required for ILC2), BATF–JUN (MA0462.1, required for ILC3), FOS–JUN (MA0099.2, associated with ‘quiescent-like’ topic 1), STAT3 (MA0144.2, TH17-reponse regulator), and precursor-associated TCF7 (MA0769.1). d, Protein measurements validate reduced post-induction production of Tsc22d3 (associated with ‘quiescent-like’ topic 1, encoding the transcription factor GILZ). Left, distributions of protein levels, measured by flow cytometry following intracellular staining of GILZ in skin ILCs from mice treated with IL-23 (top 4 tracks, red), compared with PBS (lower 4 tracks, blue) and fluorescence minus one (FMO) control (bottom track, clear). n = 4 mice for both groups, representative data from 2 experiments. Right, proportion of Gilz+ cells (average values of two independent experiments) in control and IL-23-treated mice. e–h, In vitro validation of ILC2 and ILC3-like potential. e, Cultured skin ILCs from untreated mice express type 2- (Gata3, Il13 and Areg) and type 3- (Il22 and Il17f) associated genes (panels), when appropriately stimulated. Relative expression was measured by rtPCR on total cDNA extracted from ILCs cultured for 5 days in the presence of IL-2 and ILC2-inducing cytokines (IL-25 and IL-33) or ILC3-inducing cytokines (IL-1β, IL-23 and TGFβ). Two biological replicates pooled for RNA extraction and rtPCR, n = 1 for each gene. f, Numbers (top left) of KLF2GFP+ or KLF2GFP− skin ILCs cultured in control or ILC2-inducing conditions (IL-25 and IL-33), and percentages of these cells producing IL-5, IL-17 or both IL-5 and IL-17, based on intracellular staining after 2.5 h of PMA and ionomycin stimulation (Methods). Data are pooled from 3 independent experiments (n = 4 wells control and GFP− ILC2 induced, n = 5 GFP+ induced; unpaired two-tailed t-test). g, FACS plots showing the sorting strategy for the isolation of IL-5-producing (tdTomato+) skin ILC2s from Il5cre/tdTomato (Red5) mice (top row) and analysis of the production of KLRG-1, IL-17A and IL-5 in tdTomato+ skin ILCs (remaining panels), cultured in control or ILC3-inducing conditions (IL-1β, IL-23, IL-18 and TGFβ), based on intracellular staining after 2.5 h of PMA and ionomycin stimulation (Methods). The lack of cells producing both KLRG-1 and IL-17A suggests that ‘inflammatory ILC2s’ do not underlie an ILC2-to-ILC3-like transition. h, Numbers (top) of IL-5tdTomato+ skin ILCs cultured in control or ILC3-inducing conditions (as in g), and percentages (middle row) and numbers (bottom row) of these cells producing IL-5, IL-17 or both, based on intracellular staining after 2.5 h of PMA and ionomycin stimulation (Methods). Data are pooled from three independent experiments; n = 6 control, n = 19 treated wells; error bars are mean ± s.d.; unpaired, two-tailed t-test. ILCs from KLF2-GFPtg/tg reporter and Red5 reporter for in vitro cultures were sorted as live CD45+IL-7Rα+lin− (CD3ε, CD5, CD11b, CD11c, CD19, B220, NK1.1, Ter119, Gr1, FcεRIa, TCRβ, TCRγ) GFP+ or GFP− for KLF2 expression, or CD103+ for IL-5 expression in Red5 mice.

