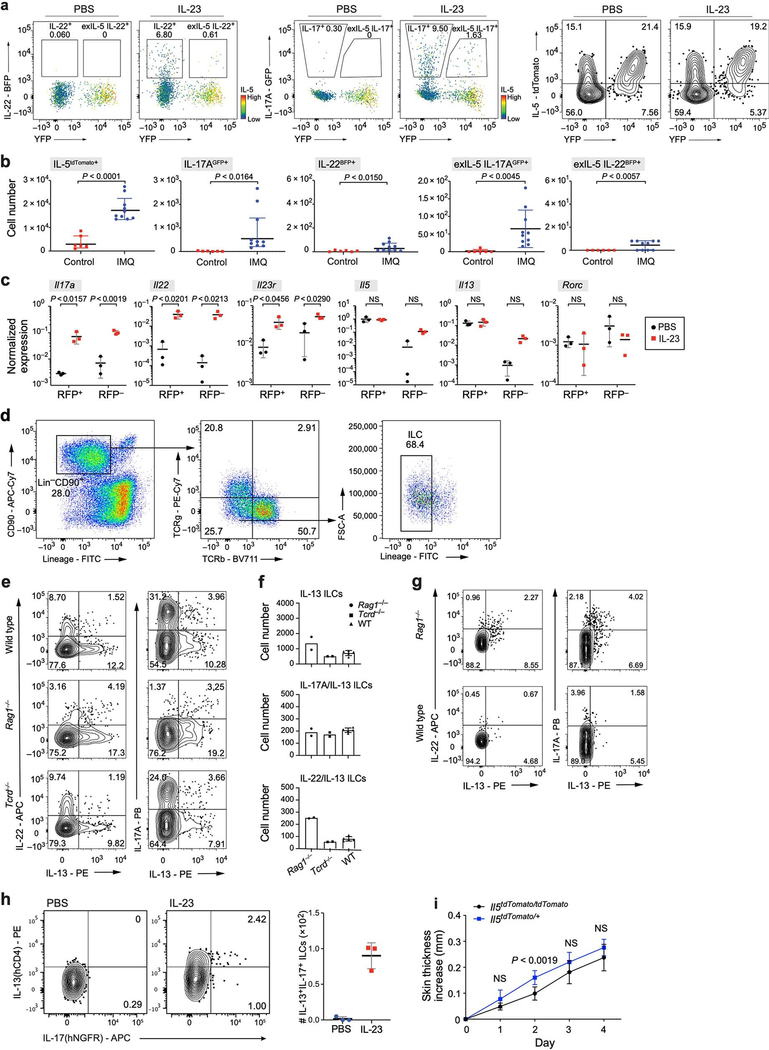
Extended Data Fig. 9. Reporter mouse systems confirm ILC2-to-ILC3-like transition of committed IL-5+ ILC2s, and mixed ILC2–ILC3 state.
a, exIL-5 cells that transdifferentiated to produce IL-22 and IL-17A no longer produce IL-5. FACS analysis indicates joint expression of the IL-5 fate reporter YFP and IL-22-BFP (left two graphs) or IL-17A-GFP (middle two graphs). Additionally, not all IL-5Cre/tdTomato+ cells recombine efficiently to be YFP+ cells (right two graphs), which suggests a greater actual number of exIL-5 cells. b, Alternative psoriasis model (imiquimod) also drove an increase in IL-17A-producing cells, including in exIL-5 cells, but induced less IL-22 production. Number of cells with the indicated reporter configuration in untreated mice (red squares) and mice topically treated with imiquimod over 10 days (blue circles). Data from 2 independent experiments; mean ± s.d.; n = 6 untreated, n = 10 imiquimod-treated mice. c, Expression (rtPCR) of genes (panels) in skin ILCs with (RFP+) and without (RFP−) recorded IL-13 fate mapping (Methods) from PBS- and IL-23-treated Il13YetCre/+R26RAi14RFP/+ mice. n = 3 biological replicas for each group; two-way ANOVA, Bonferroni adjusted. d, Gating strategy on CD45+ cells for experiment in e– g. ILCs are defined as CD90.2+ and lLin− (CD4, CD8, TCRβ, CD11b, CD11c, CD19, B220, NK1.1, Ter119, Gr1, FcεRIa), followed by additional exclusion of CD3e+ and TCRγδ+ cells. e–h, IL-23 treatment induces cells producing both IL-13 and IL-22 or both IL-13 and IL-17A. e, FACS plots show production of IL-13, IL-22 (left), and IL-17A (right) after IL-23 induction in wild-type (top, n = 5), Rag1−/− (middle, n = 2) and Tcrd−/− (bottom, n = 2) mice, measured by intracellular cytokine staining of skin ILCs stimulated by PMA and ionomycin. f, Summary of the number of cells producing IL-13 (top), and co-producing IL-13 and IL-17A (middle) or IL-13 and IL-22 (bottom) in each mouse genotype. Error bars for WT are mean ± s.d. Experiments were repeated with similar results. g, FACS plots analogous to those in e (excluding Tcrd−/−), with mice treated with IL-23 and IL-1β with intracellular cytokine staining done without ex vivo PMA and ionomycin treatment (representative plots of n = 4 mice for each group, two experiments). h, Representative FACS plots show production of IL-13 (reported by human CD4) and IL-17A (reported by human NGFR) in skin ILCs from reporter mice (Il13Smart/SmartIl17aSmart/Smart) on the wild-type background (Methods) (n = 3 biological replicas per group). ILCs were defined as CD45.2+CD90.2+IL-7Ra+ and Lin− (CD3, CD4, CD5, CD8α, CD11b, CD11c, CD19, NK1.1, F4/80, Gr-1, CD49b, FcεRIa and Ter119). i, IL-23 skin injection model in Il5cre/tdTomato (Red5) mouse strain. Increase in skin thickness (mean ± s.d.) over time is similar in homozygote Red5/Red5 mouse strain lacking expression of IL-5 cytokine (black) and in Red5/+ mouse (blue). n = 8 mice for both groups, two independent experiments; repeated measures two-way ANOVA with Geisser– Greenhouse correction, Bonferroni adjusted.

