Fig. 9.

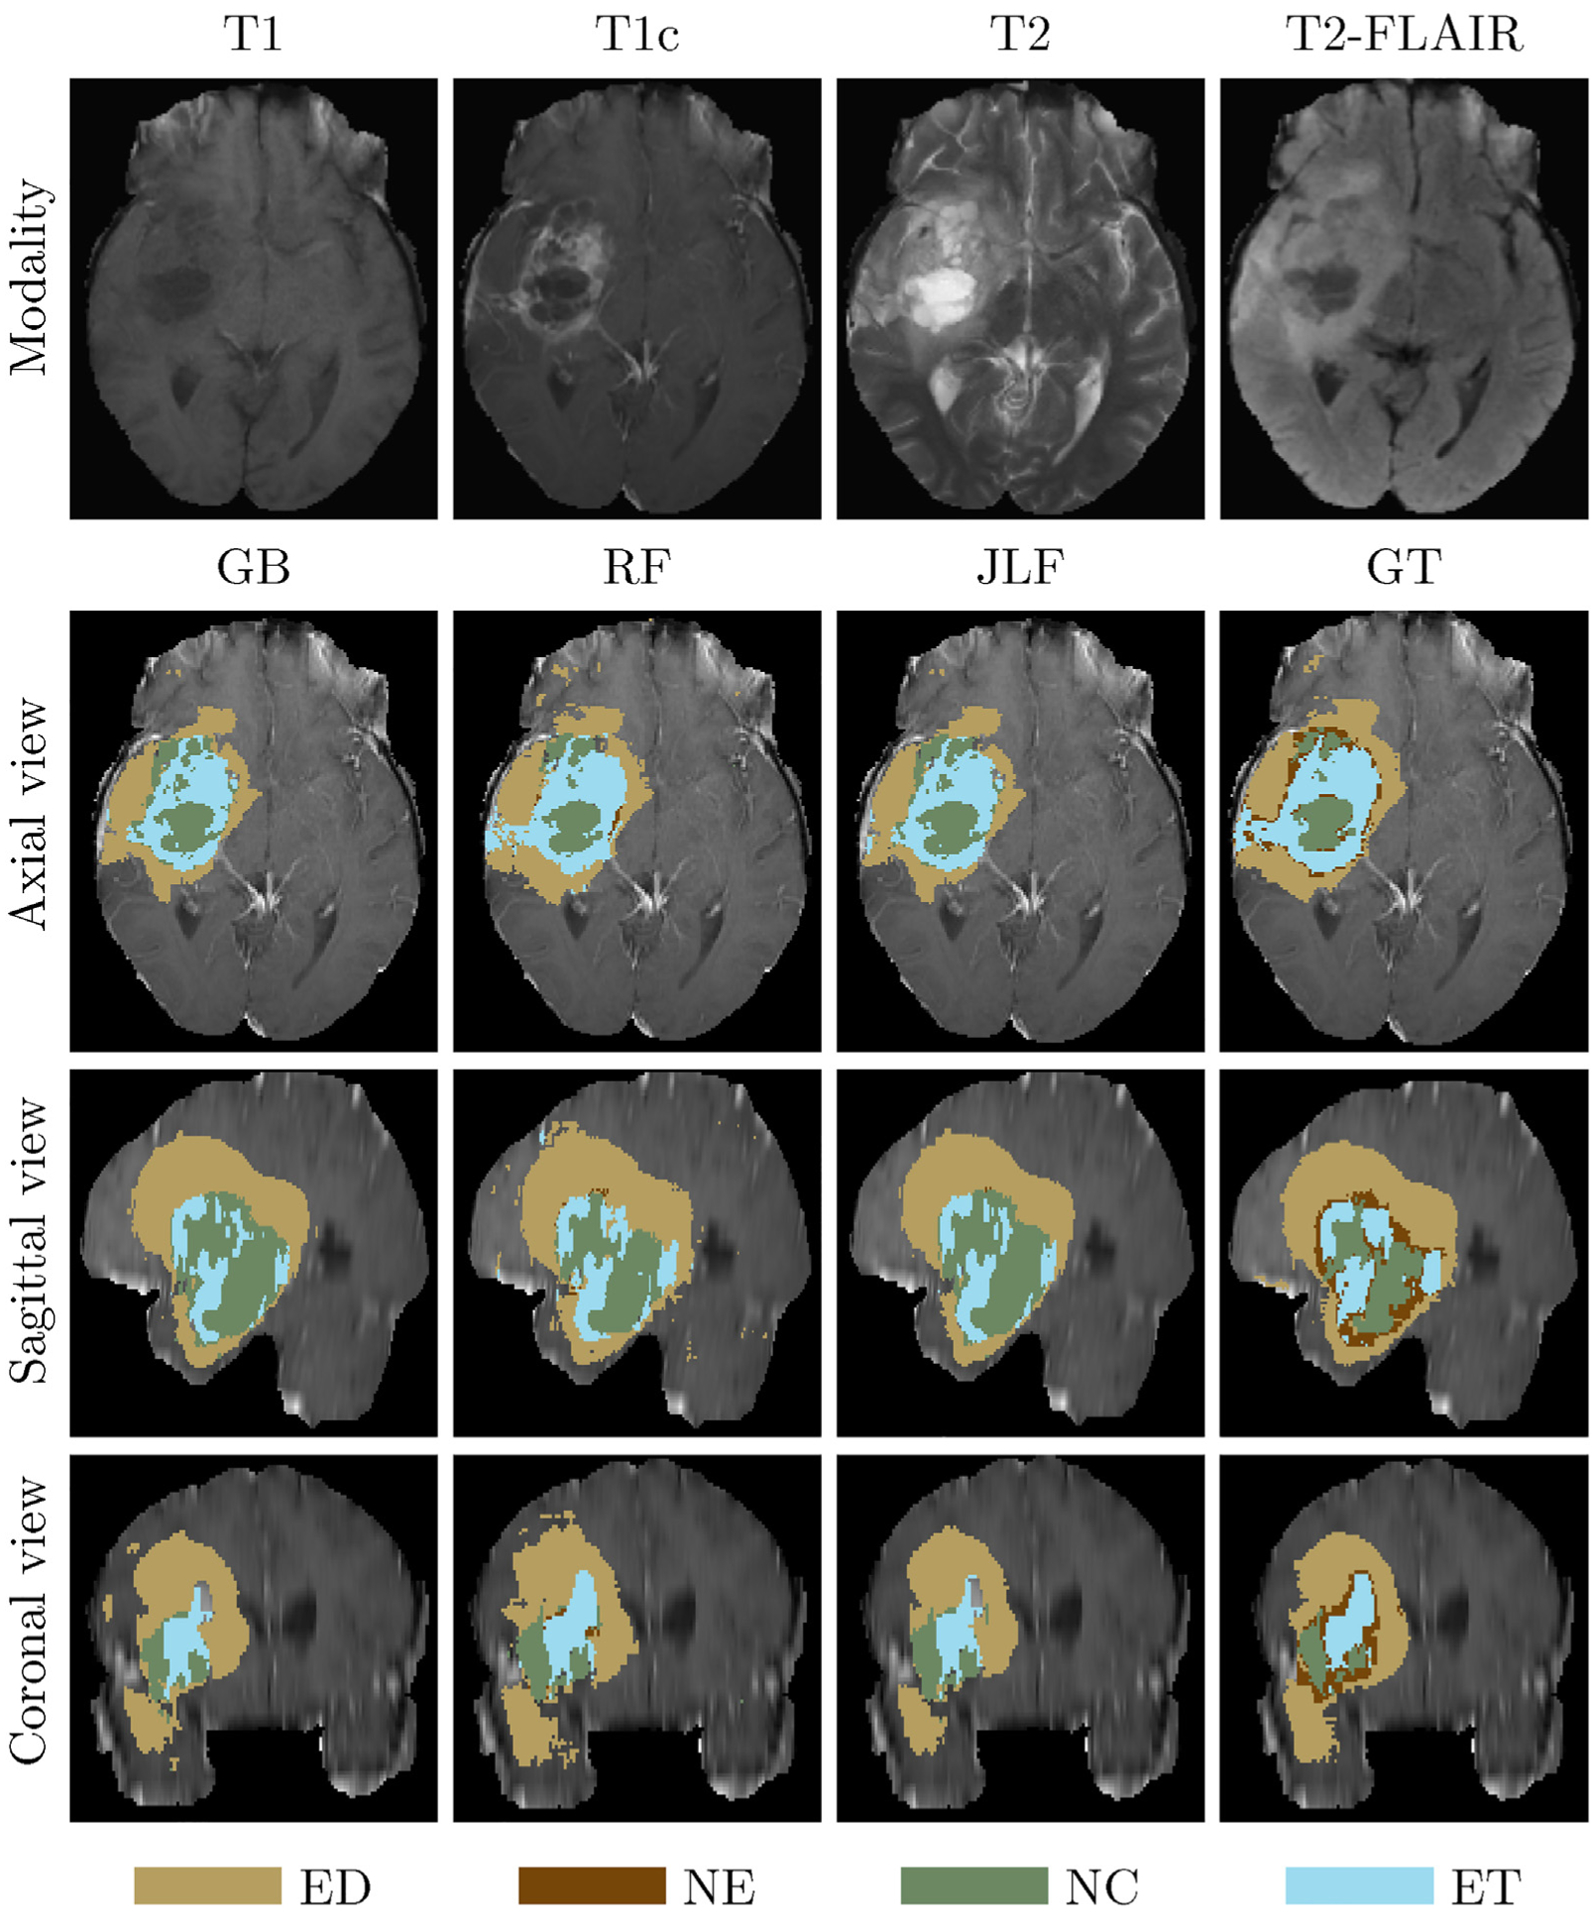
An example of label fusion-based application. The first (top) row denotes the input brain scans. Rows 2–4 illustrate shows the axial, sagittal, and coronal views, respectively, of the T1c input scan overlaid with GB, RF, JLF and GT labels.

An example of label fusion-based application. The first (top) row denotes the input brain scans. Rows 2–4 illustrate shows the axial, sagittal, and coronal views, respectively, of the T1c input scan overlaid with GB, RF, JLF and GT labels.