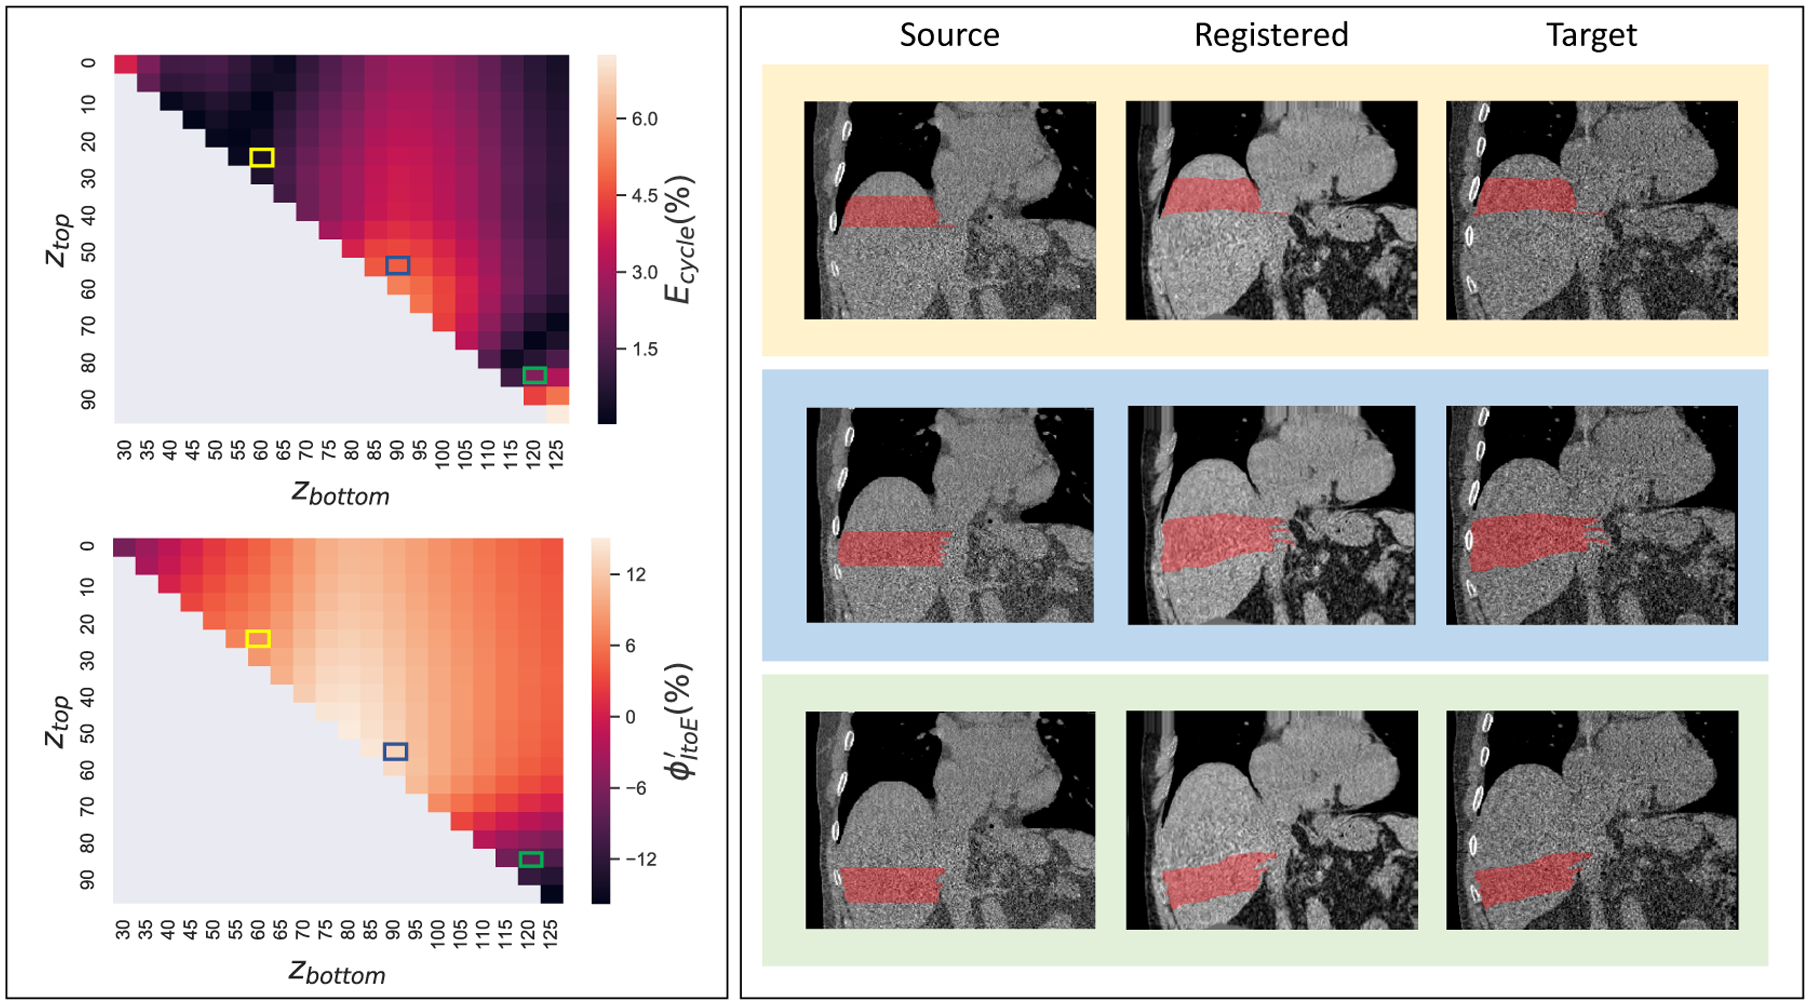
Figure 4.

This figure shows the distribution of cycle consistent error Ecycle and volumetric variation by permutating ztop and zbottom for all possible liver sections. The left panels present the Ecycle and by changing ztop and zbottom. In the right panels, three representative liver sections (red) are presented, which are corresponding to the three rectangles in Ecycle and maps.
