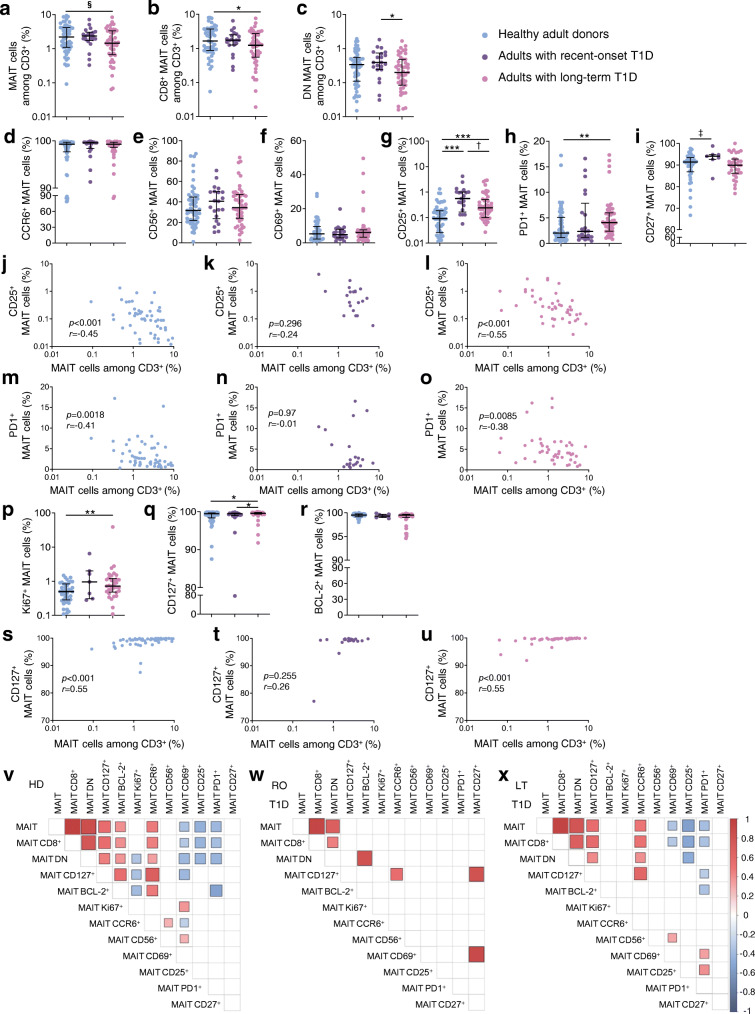
Fig. 1.
Frequency and phenotype alterations of circulating MAIT cells in adults with type 1 diabetes. PBMCs (5 × 10⁶) were collected from healthy donors (n = 55) and from adults with recent-onset (n = 21) or long-term (n = 47) type 1 diabetes and were analysed by flow cytometry. (a–c) Circulating MAIT (a), MAIT CD8+CD4− (b) and MAIT CD8−CD4− (DN) (c) cell frequencies among CD3+ cells. (d–i) Frequencies of CCR6+ (d), CD56+ (e), CD69+ (f), CD25+ (g), PD1+ (h) or CD27+ (i) MAIT cells among total MAIT cells. (j–o) Correlations between frequency of circulating MAIT cells and frequency of CD25+ (j–l) or PD1+ (m–o) MAIT cells in healthy donors and participants with recent-onset or long-term type 1 diabetes. (p–r) Frequencies of Ki67+ (p), CD127+ (q) or BCL-2+ (r) MAIT cells among total MAIT cells in healthy donors (n = 42, 55, 42 for p, q, r, respectively) and participants with recent-onset (n = 7, 21, 7, respectively) or long-term (n = 33, 47, 33, respectively) type 1 diabetes. (s–u) Correlations between frequency of circulating MAIT cells and frequency of CD127+ MAIT cells in healthy donors (n = 55) (s) and participants with recent-onset (n = 21) (t) or long-term (n = 47) (u) type 1 diabetes. (v–x) Correlograms of circulating MAIT cell frequency and marker expression in healthy donors (n = 42–55) (v) and participants with recent-onset (n = 7–21) (w) or long-term (n = 33–47) (x) type 1 diabetes. Only significant Spearman’s correlation coefficients are represented, by colour intensity and square size. Each symbol represents a single individual (a–u) and small horizontal lines indicate the median with the IQR (a–i, p–r). *p < 0.05, **p < 0.01 and ***p < 0.001 (a–i, p–r); §p = 0.062 (a); †p = 0.051 (g); ‡p = 0.052 (i) (non-parametric two-tailed Mann–Whitney test [a–i, p–r] or Spearman’s correlation test [j–o, s–x]). HD, healthy donors; LT, long-term; RO, recent-onset; T1D, type 1 diabetes

