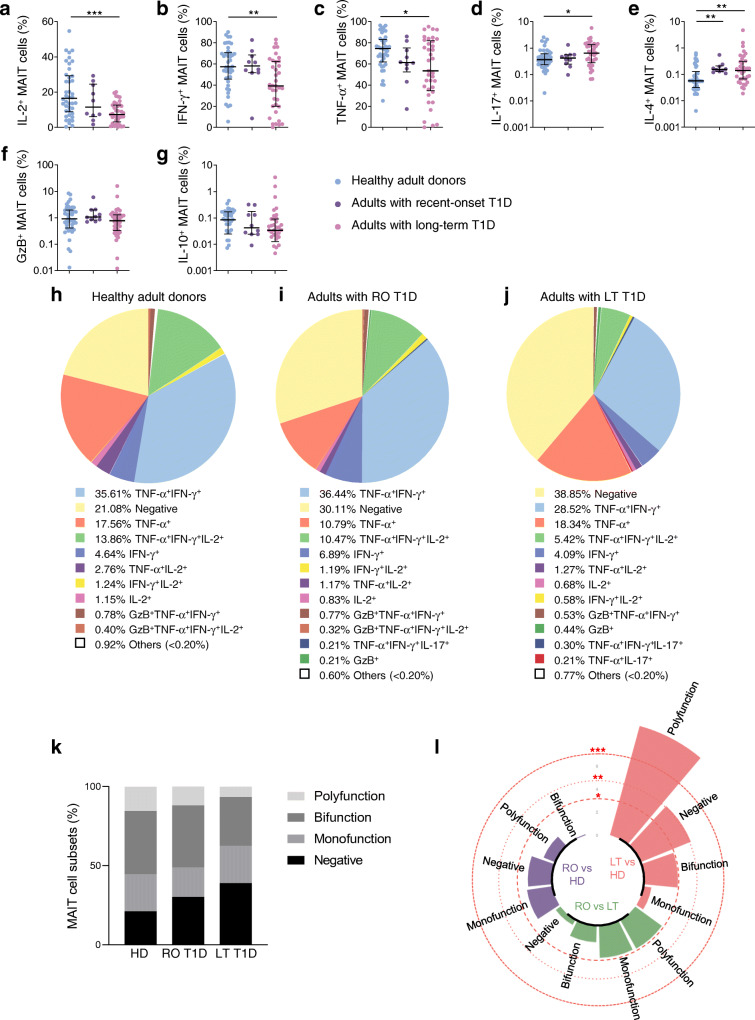
Fig. 2.
Functional alterations of circulating MAIT cells are correlated in adults with type 1 diabetes. (a–g) Flow cytometry analysis of IL-2+ (a), IFN-γ+ (b), TNF-α+ (c), IL-17+ (d), IL-4+ (e), GzB+ (f) and IL-10+ (g) MAIT cells among total MAIT cells in healthy donors (n = 42), and adults with recent-onset (n = 10) or long-term (n = 37) type 1 diabetes. (h–j) Pie charts showing MAIT cells producing Th1 cytokines, IL-17 and/or GzB, in healthy donors (h), adults with recent-onset type 1 diabetes (i) or long-term type 1 diabetes (j). (k) Bar plot representative of cumulative Th1 cytokines, IL-17 and GzB, production by MAIT cells, classified as producing none (negative), one (monofunction), two (bifunction) or more than two (polyfunction) of these factors. (l) Circular bar plot represents negative loge p values of the proportion differences between healthy donors (n = 42) and adults with recent-onset (n = 10) or long-term (n = 37) type 1 diabetes. Red dashed circles represent p values. Each symbol represents a single individual and small horizontal lines indicate median with IQR (a–g). *p < 0.05, **p < 0.01 and ***p < 0.001 (non-parametric two-tailed Mann–Whitney test [a–g, l]). HD, healthy donors; LT, long-term; RO, recent-onset; T1D, type 1 diabetes

