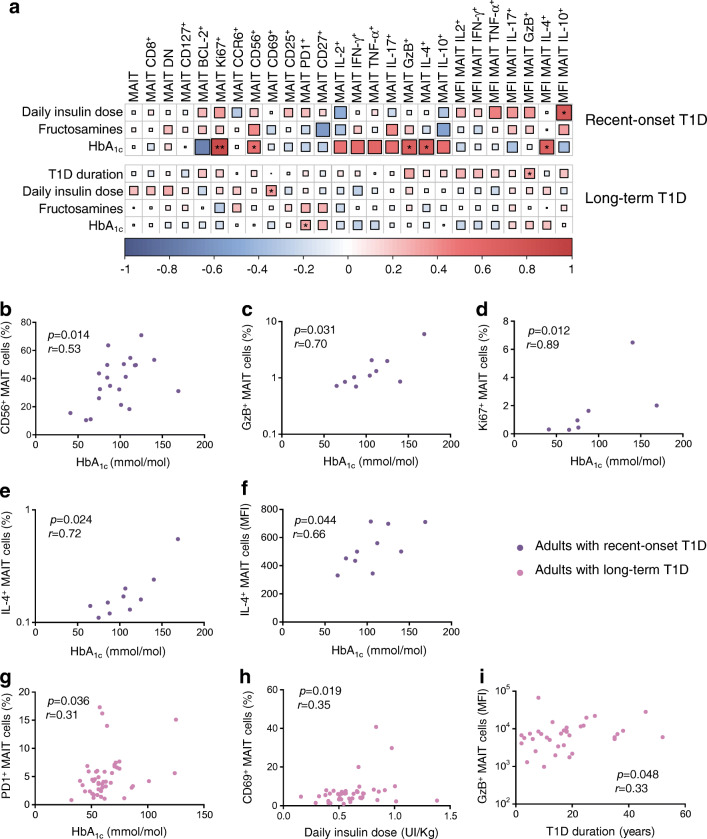
Fig. 4.
MAIT cell alterations correlated with glycaemic variables in adults with type 1 diabetes. (a) Correlograms of circulating MAIT cell frequency, phenotype and function previously analysed and clinical variables (daily insulin dose, fructosamine level, HbA1c level and type 1 diabetes duration) in adults with recent-onset (n = 5–21) or long-term (n = 24–47) type 1 diabetes. Spearman’s correlation coefficients are represented by colour intensity and square size. Asymptotic p values are displayed. All correlations are shown, with asterisks denoting those that are significant. (b–f) Correlations between CD56+ (b), GzB+ (c), Ki67+ (d) and IL-4+ (frequency, e and MFI of positive cells, f) MAIT cells with HbA1c level in adults with recent-onset type 1 diabetes. (g–i) Correlations between PD1+ MAIT cells and HbA1c level (g), between CD69+ MAIT cells and daily insulin dose (h), and between MFI of GzB+ MAIT cells and type 1 diabetes duration (i) in adults with long-term type 1 diabetes. Each symbol represents a single individual (b–i). *p < 0.05 and **p < 0.01 (non-parametric Spearman’s correlation test [a–i]). T1D, type 1 diabetes

